


Data trend analysis is a strategy used in making future predictions based on historical data. It allows to compare data fields over a given period of time and identify uptrends, downtrends, and stagnation.
If a trend is stable and steady over a period of time, it indicates consistency and invokes more certainty than a trend that is drastically changing positions. However, inconsistent trends might be more attractive to some investors who analyze certain external factors contributing to the radical trend changes.
High risk usually involves chances of high rewards.
Investors and business managers use this information to make data-driven decisions and improve strategies.
Let’s find out more about trend analysis definition, its benefits, and real-life market trend analysis examples.
What is trend analysis?
As we mentioned before, trend analysis is the process of examining historical data to identify patterns, trends, and potential future movements. It is widely used in finance, marketing, business strategy, and other fields to make data-driven decisions often powered by structured B2B data lists that make large-scale analysis more efficient. By analyzing trends, organizations can anticipate market shifts, customer preferences, and industry developments.
Trend analysis can be categorized into three main types based on the time frame:
- Short-term trend analysis focuses on immediate patterns, typically spanning days to a few months. It is useful for identifying sudden shifts in consumer behavior, stock market fluctuations, or seasonal trends.
- Medium-term trend analysis examines trends over several months to a few years. This type helps businesses adjust strategies, such as adapting to emerging industry changes or refining marketing campaigns based on shifting customer preferences.
- Long-term trend analysis looks at patterns that develop over many years or decades. It provides insights into broad economic cycles, technological advancements, and significant industry transformations, helping organizations plan for sustainable growth.
By distinguishing between these time frames, businesses and analysts can apply trend analysis effectively to gain strategic insights and make informed decisions.
Why is trend analysis important?
Trend analysis is essential because it helps businesses, investors, and decision-makers anticipate changes, reduce risks, and capitalize on emerging opportunities. By identifying patterns in data, organizations can make informed strategic decisions rather than relying on guesswork.
By leveraging trend analysis, businesses can stay proactive rather than reactive, ensuring sustained growth and adaptability in a constantly evolving market.
How to conduct trend analysis?
Conducting trend analysis involves systematically collecting, analyzing, and interpreting data to identify meaningful patterns. By following a structured approach, businesses can gain actionable insights and make informed decisions.
1. Identify data sources
The first step in trend analysis is determining reliable data sources. These may include internal business data (such as sales reports, website analytics, and customer feedback), industry reports, market research, social media trends, and economic indicators. Data quality, relevance, and freshness are crucial for accurate trend analysis. Historical data shows where a trend has been. Real-time data shows where it is heading now. Using both gives you the most complete and actionable view of any trend.
2. Choose the right trend analysis method
There are various methods for analyzing trends, depending on the type of data and the objective of the analysis. Common approaches include:
- Descriptive analysis – Summarizing historical data to identify existing patterns.
- Comparative analysis – Comparing data across different time periods or segments.
- Predictive analytics – Using statistical models and machine learning to forecast future trends.
- Technical analysis – Common in financial markets, this method examines price movements and market behavior.
Choosing the right method ensures that trend analysis is aligned with business goals.
3. Interpret data and identify patterns
Once the data is collected and analyzed, the next step is to interpret the findings. Look for recurring trends, correlations, and anomalies in the data. Distinguish between short-term fluctuations and meaningful long-term patterns. Visualization tools such as graphs, heatmaps, and trend lines can help highlight insights effectively.
4. Apply insights to business strategy
The final step is translating trend insights into actionable strategies. Businesses can use these findings to refine marketing campaigns, optimize product offerings, adjust pricing strategies, or identify new market opportunities. Continuous monitoring and updating of trends ensure that companies stay agile and responsive to changes.
By following these steps, organizations can leverage trend analysis to drive data-driven decision-making and stay ahead in a competitive landscape.

Types of trend analysis
Trend analysis is computed using numerical data. This information is usually historical data, either traditional data in the form of a company’s performance taken from its public financial statements or public web data, such as the number of job postings of a competitor in the past five years. When adding numerical data to a chart, you will be able to identify three types of trends.
Upward trend (bull market)
An uptrend or an upward trend could have different meanings.
For instance, you are a business owner looking at the price of raw materials required to produce bread, and you notice that the price is increasing. This information could help you make different predictions, such as increased costs for your business or the necessity of raising the prices for the final consumer.
At the same time, an investor looking at the share price of company X who noticed an upward trend might decide to buy the stock since the price is increasing. An upward movement in a stock’s price generally indicates a favorable condition, helping you to determine if the stock is a worthwhile investment.
Downward trend (bear market)
On the opposite side, a downward trend indicates the decreasing value of your variable. For example, if a company’s profit has a sharp decline, this may require investors to proceed with caution as the stock is risky since the price is going down. This also applies when other economic or financial variables have a downward trend.
When investors research financial assets, trend analysis can be done on the asset’s historical data. If this price is decreasing, it indicates the presence of a bearish market. In other words, investment is not recommended because the prices could further decrease, leading to a loss.
Horizontal trend
Finally, the horizontal line indicates stagnation. In other words, the prices, or any other metrics, are not going up or down; rather, they are stagnant.
In practice, a flat trend might go up for one period, then pull a trend reversal, reaching a steady general direction overall. Making investment decisions based on horizontal trends is risky because you do not know what will happen. However, if you decide to go with it, a sophisticated revenue and cost analysis regarding the sales regions must be implemented to calculate the risks.

Perform trend analysis with fresh web data
Leverage historical data to identify potential investment opportunities.
Benefits of trend analysis
Beyond its role as an investment analysis tool, trend analysis provides a wide range of advantages that enhance decision-making, improve operational efficiency, and strengthen business strategy. Some of the key benefits include:
- Competitive benchmarking – Businesses can compare their performance with competitors over the same period, gaining insights into their market position and identifying areas for improvement.
- Versatile data application – Trend analysis works with both traditional financial data (profit, expenses, revenue) and alternative datasets such as public web data, reviews data, or website traffic
- Forecasting actionable trends – Identifying long-term trends allows businesses to recognize recurring patterns, enabling them to make data-driven predictions and adapt their strategies accordingly.
- Financial statement accuracy – Organizations can use trend analysis to detect inconsistencies in preliminary financial statements, ensuring that adjustments are made before public release to maintain accuracy and compliance.
- Market trend detection – Investors and analysts can monitor stock market movements to identify early signs of potential trend shifts, helping them make informed decisions on buying, selling, or holding assets.
- Optimized marketing strategies – By tracking consumer behavior and engagement trends, businesses can refine their marketing campaigns, adjust messaging, and allocate budgets more effectively.
- Risk mitigation – Trend analysis helps companies anticipate potential downturns or challenges in their industry, allowing them to take proactive measures to minimize risks.
- Customer insights and personalization – By analyzing purchasing patterns and customer preferences, businesses can enhance product offerings, improve customer experience, and create personalized marketing strategies.
- Operational efficiency – Identifying inefficiencies or trends in supply chain performance, production output, and resource allocation enables businesses to streamline operations and reduce costs.
- Regulatory compliance and fraud detection – Trend analysis can reveal unusual financial or operational patterns that may indicate compliance risks or fraudulent activities, allowing companies to take corrective action in time.
By leveraging these benefits, organizations can strengthen their strategic planning, improve financial performance, and stay ahead of industry shifts in an increasingly data-driven world.
Trend analysis examples
Trend analysis is a valuable tool used across various business functions to identify patterns, predict future outcomes, and make data-driven decisions. By analyzing historical data, organizations can uncover insights that help optimize strategies, improve efficiency, and enhance overall performance. Different departments—such as marketing, accounting, sales, human resources, and supply chain management—rely on trend analysis to stay competitive and adapt to changing market conditions.
Below are three detailed examples of how trend analysis is applied in different business areas:
By applying trend analysis in different departments, businesses can make data-driven decisions and improve overall performance.
Challenges and limitations of trend analysis
Trend analysis is a valuable tool, but it comes with several challenges that businesses must navigate carefully. One of the biggest difficulties is identifying turning points in trends. While shifts become obvious in hindsight, it is much harder to determine in real time whether a deviation is a temporary fluctuation or the beginning of a lasting change. Misreading these signals can lead to poor strategic decisions.
Another limitation is data availability and reliability. Long-term trend predictions require a significant amount of historical data, which may not always be accessible—especially for new businesses or product lines. Without sufficient data, forecasts can be inaccurate or misleading. Even when data is available, there is always a risk of misinterpretation. Trends do not always follow a clear pattern, and businesses may mistakenly assume causation where only correlation exists. Acting on faulty conclusions can lead to costly errors.
Key caveats of any trend analysis include recognition that prior trends do not always continue into the future. Also, short-term linear trends may actually be non-linear over longer periods, plus long-term linear trends may have short-term cycles. Finally, trend analyses are lousy at picking up black-swans or even slightly-grey-swans.
- John A. Kilpatrick, Ph.D. MAI, Greenfield Advisors
External factors also play a significant role in shaping trends, often in unpredictable ways. Economic downturns, political events, regulatory changes, and global crises can disrupt market patterns, rendering historical data less useful for future predictions. Additionally, time-related uncertainties increase the likelihood of errors in long-term forecasts. The further a business projects into the future, the more unpredictable the landscape becomes due to emerging technologies, shifting consumer behaviors, and unforeseen industry disruptions.
Bias in data selection presents another challenge. Companies may focus too heavily on favorable data while ignoring contradictory information, leading to overconfidence in their analysis. Furthermore, many trends function as lagging indicators, meaning they only become apparent after they have already begun. By the time a trend is fully recognized, it may be too late to take advantage of the opportunity or mitigate risks.
Industries that experience rapid change, such as technology and digital markets, present an even greater challenge for trend analysis. The fast pace of innovation and shifting consumer preferences make it difficult to rely on past data for accurate future predictions. Given these challenges, businesses should approach trend analysis with caution, supplementing it with real-time monitoring and other strategic tools to ensure informed decision-making.

What are the tools used for trend analysis?
Choosing the right trend analysis methods and tools ensures accurate insights and better decision-making.
Preparation
In order to do trend analysis, you must decide on what segment, industry, or even asset you want to use. For example, you may want to look at the bond market.
Once you make this decision, you also need to determine the period. There is no consensus on the actual amount of time for the movement to be considered a trend.
As a result, this depends on the historical data available and your purposes.
Trend analysis tools
There are numerous management tools for trend analysis. One of the most basic ones is to simply plot the data and visually establish the presence of a trend. For example, one of the most popular data plotting tools is Tableau which allows you to visualize the data through graphs, charts, and other models. Another option is to transform this data into moving averages that will eliminate fluctuations for better trend identification.
As a result, you must have access to the following:
- Raw numerical data
- Access to analysis software
Trend analysis tools help businesses track patterns, identify market shifts, and make data-driven decisions. From search trends to financial forecasting, these tools provide valuable insights across industries. Here are some of the most popular options:
Trend analysis examples
Trend analysis that uses business information can be useful for both managers and stakeholders, including potential investors. For instance, you can perform a trend analysis using public web data, such as website traffic for any given company.
Let's say you know the total website traffic in the six months for company A, an online store that sells gifts. Data suggests an uptrend during the holiday season, reaching the peak on the 20th of December, 2024. After the first half of January, there has been a relatively horizontal trend. In other words, if you had a competing gift store, you could compare your performance to this company. Although intuitive, this example of trend analysis helps you predict future results and performance or compare this company to a competitor’s activity.
One of the most common trend analysis strategies is when you are examining the share price of a financial asset to help with the decision-making process. For example, the figure below compares the share prices of two companies, X and Y, over one year.

Company X shows an overall uptrend over the past year with a small trend reversal in February. However, company Y had a horizontal trend for the first half months, after which it started to decrease.
Generally, investors are more cautious when there is a horizontal trend because it is difficult to forecast when the price will change its direction and whether it will be up or down. In this case, the share price has a steady decrease, which will result in a loss if added to your portfolio.
Trend analysis is only as good as the information you have available. And even if you believe to have the most accurate information available, statistical noise along with randomness will always be present to distort your results. Therefore, you have to be very objective about your results and not let your sentiments drive your decisions. Furthermore, you have to combine different analytical techniques since no one method will provide you the most accurate result.
Alex Williams, CTO of FindThisBest
Company X’s increasing trend might help you predict future events and indicate that this stock is a great addition to an investor’s portfolio, especially if you have a long-term investment strategy.
However, other information should also be considered when performing a trend analysis, both related to the company itself and the overall market and the economy. Trend analysis is only one tool that investors can use to identify the profitability of a given asset.
Trend analysis using Coresignal's historical data
You can also perform trend analysis by leveraging our public web data. For example, our historical headcount data allows you to see employee number changes over time in a specific company. In investing, it provides you with valuable insights into the company's growth and longevity. For the most complete analysis, pair Coresignal’s historical data with real-time data feeds: historical records show you how a trend developed over time, while real-time updates tell you whether that trend is still intact today.
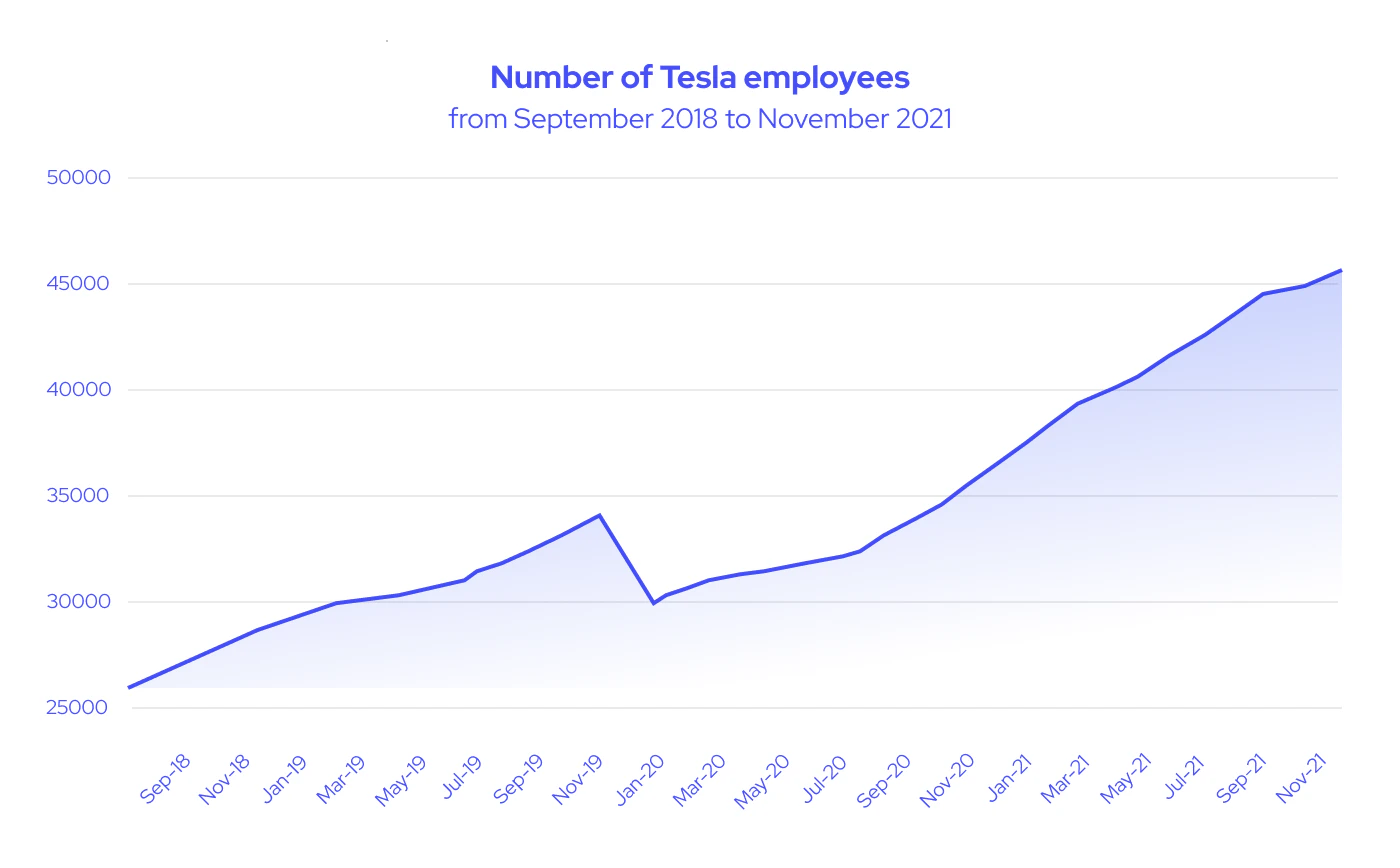
In the figure above, you can see Tesla's headcount change from September 2018 to November 2021. From this graph, you can try to make sense of what happened during the transition from the end of 2019 to the beginning of 2020 that caused a drop in headcount.
Going further, you see that the employee number kept growing steadily and consistently. You can make a prediction that the trend will keep increasing at a steady rate unless the same thing that happened at the end of 2019 happens again.
As an investor, you would need to perform an analysis and figure out what caused the drop and whether the company has implemented prevention methods to keep that from happening again.
We offer historical data starting from 2018. The longer the time period, the more notable the trend. With up to 5 years of historical data, you can analyze if and how seasons, certain political events, and other ESG factors affect a company's performance.
Summary
In general, trend analysis is extremely valuable for investors and business owners. Considering the current data availability, the value of trend analysis is inseparable from data-driven decisions, especially while leveraging public web data.
Public web data allows you to perform a more in-depth analysis, in turn outsmarting a part of your competition that is not using external data to their advantage. Data-driven trend analysis is also a great way of anticipating future events that could enhance your investment intelligence and find better business opportunities. Coresignal's combination of historical records and real-time data APIs gives you both the depth and currency needed for trend analysis that is truly forward-looking.
Stay ahead of the game with fresh web data
Coresignal's data helps companies achieve their goals


