

What is industry benchmarking?
Industry benchmarking is the process of using business metrics to evaluate a company's performance against itself, industry standards, and competitors. Benchmarks may use both quantitative and qualitative indicators such as revenue growth, customer satisfaction, and operational efficiency.
As you read this, companies gather public data on competitors to make data-driven decisions, confirming R. W. Emerson’s adage: there is no knowledge that is not power. And in 2026, information freshness matters more than ever. Outdated benchmarks show an industry that no longer exists. Real-time sources like Coresignal keep your benchmarks grounded in current events, not last quarter.
This article explains how to evaluate business performance with industry benchmarking. You will learn to find benchmarks and key metrics in reports. Furthermore, we describe where to access industry data for competitive benchmarking.
Competitive benchmarking vs industry benchmarking
Competitive benchmarking and industry benchmarking are closely related, but they answer different questions.
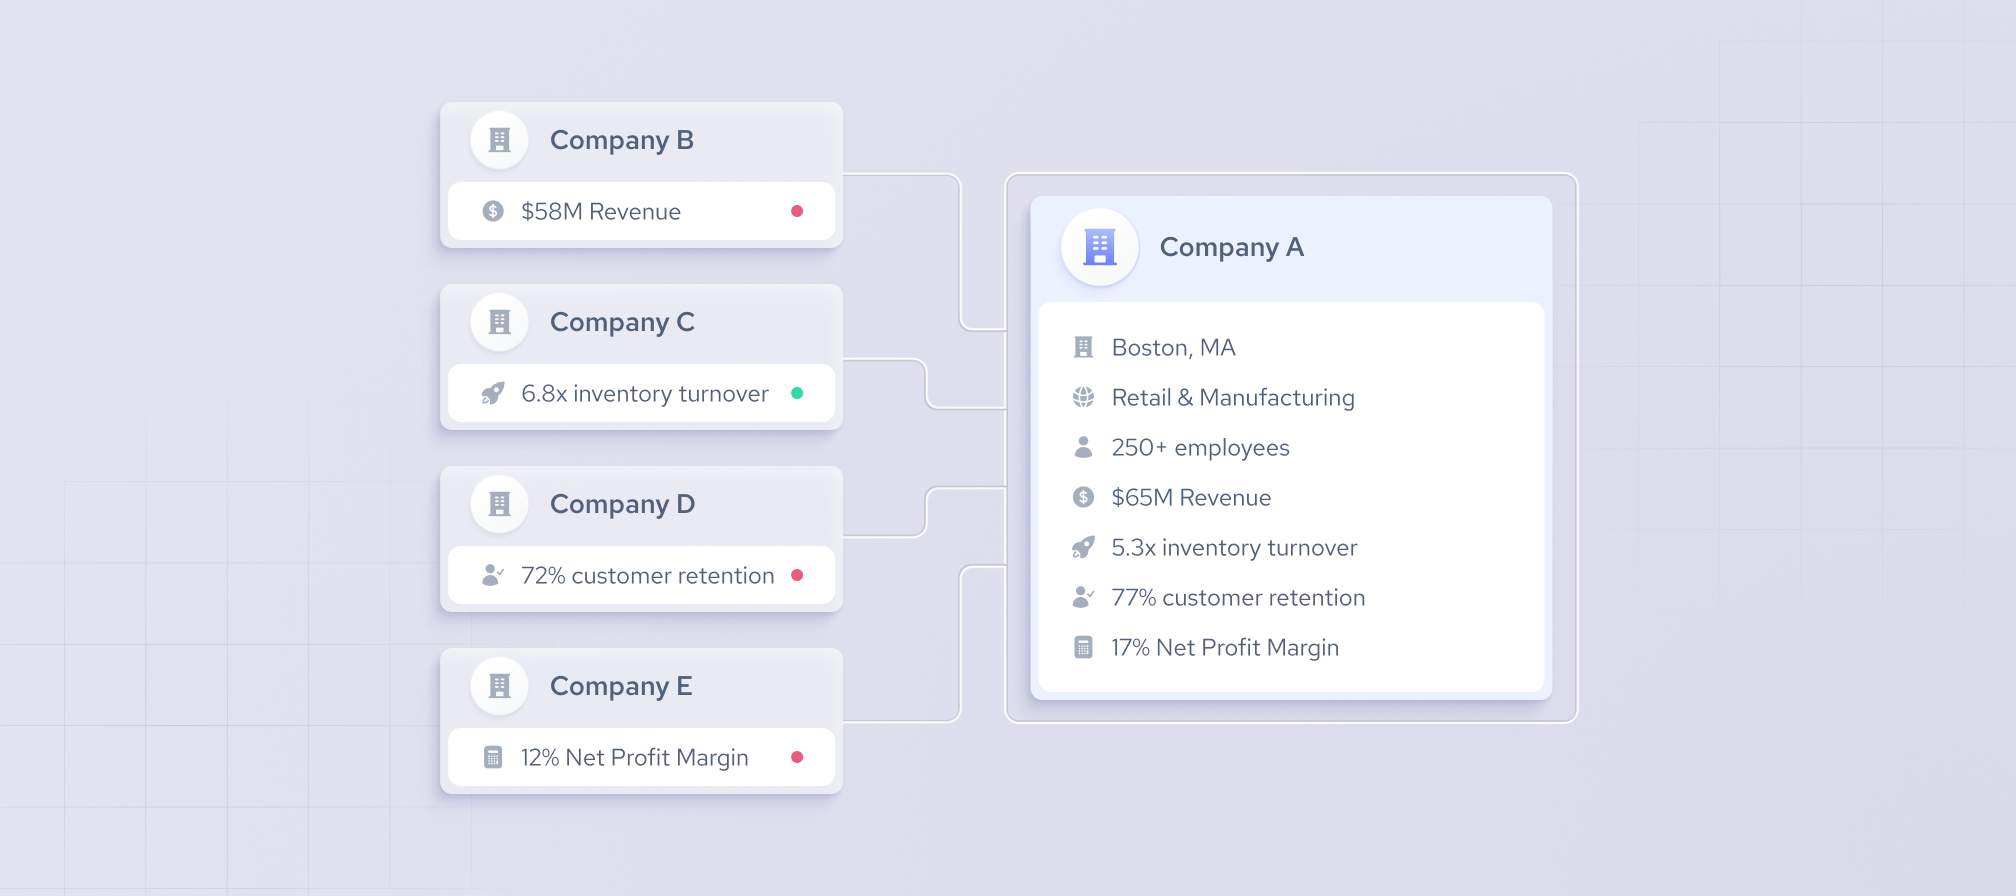
Competitive benchmarking asks: How do we perform versus our direct competitors? Industry benchmarking takes a wider view and answers the question: How do we perform relative to the market standard? It measures your performance against the industry average or recognized best-in-class standards.
The two approaches work best together. Competitive benchmarking tells you how to win the game you're already in. Industry benchmarking tells you whether you're playing the right game at all. A company can outperform all its direct rivals and still be falling behind the larger market shift, or vice versa. Using both lenses gives you a complete picture: the tactical clarity to compete today, and the strategic context to position yourself for tomorrow.
Types of industry benchmarking
Industry benchmarking comes in four main forms, each suited to different questions and goals:
- Internal benchmarking compares performance across departments, teams, or locations within your own organization. It's ideal for large companies that want to identify what's working in one area and replicate it across the business.
- Competitive benchmarking measures your metrics directly against those of rival companies in your industry, giving you a clear view of where you stand in the competitive landscape.
- Functional benchmarking looks beyond your industry, comparing a specific function, such as customer support, logistics, or onboarding, against companies known for excelling in that area, regardless of sector.
- Generic benchmarking goes even further, focusing on universal best practices and processes that transcend industry lines, such as supply chain management or talent development.
Ultimately, the right type depends on what you're trying to improve. Start internal if you want to align your own operations, go competitive to sharpen your market positioning, and look to functional or generic benchmarking when you need a breakthrough that your industry hasn't yet figured out.
Where to find industry benchmark data
Industry benchmarks are calculated by collecting and analyzing public data across a group of entities. For instance, a law company might collect financial and performance data from a wide range of competitors. This industry data often includes key metrics, such as revenue growth, operational costs, and gross margins.
In the US, industry benchmarks can be obtained from the US Census, the US Bureau of Labor Statistics, local government, and third-party market data.
The first two institutions have stats on profit and non-profit organizations nationwide, including employee demographics and industry-specific surveys. Some of the data might be a bit outdated, but it can still be used to draw valuable conclusions. The US Census and the US Bureau of Labor Statistics also aggregate data from other federal sources, making them great starting points for finding industry benchmarks.
Local government is another excellent source for industry benchmarking data. While they might not have everything readily available online, contacting a representative should put you on track. Such information is especially helpful if your business is region-based, as the local population might have different preferences than your average US citizen.
Now, third-party benchmarking data is not available freely but is actually sold by the vendor. Usually, it's collected from public web sources and structured into specific business data lists and industry datasets. Among the most popular are firmographic, employee, and job posting data from LinkedIn, Glassdoor, Owler, Indeed, and other sources.
Once again, the freshness of such industry data is of utmost importance. Reliable company data providers should offer at least monthly updates and quality customer support. At Coresignal, real-time data delivered via APIs keeps your benchmarking truly reflective of where the market stands right now.
How to do industry benchmarking (step-by-step)
Competitive benchmarking analysis is a process that allows organizations to compare their performance against the industry or competitors. This will enable them to identify areas for improvement and adopt best practices.
First, each company's data is analyzed to determine key metrics, such as average revenue growth or operational efficiency. Later, the scores of all companies are used to get the industry benchmark.
Here's a step-by-step guide on how to do industry benchmarking:
Step 1. Define objectives and performance metrics
- Look for opportunities to improve. Evaluate your business performance and strategies. Search for opportunities to enhance productivity, sustainability, customer satisfaction, and overall efficiency.
- Set clear goals. Create targets that align with your goals, such as reducing churn rate or increasing cross-selling by 10% next month.
Step 2. Collect and prepare data
- Document your processes. Understand your existing operations and benchmarks.
- Collect data. Gather relevant information from your employees, customers, and VIPs. Use quantitative and qualitative surveys, interviews, and available internal data. Consider public databases, industry reports, and business datasets for external data.
- Ensure data quality. Verify data reliability and freshness to guarantee accuracy. Markets change quickly, so keep data up to date. Use sources like Coresignal's company, employee, and jobs data APIs, to ensure the benchmarks you build reflect today's competitive landscape, not just a historical one.
Step 3. Find strategic benchmarking partners
- Look for partners. Search for companies within your industry that use best practices or have significant achievements in your benchmarking areas.
- Evaluate compatibility. Potential business benchmarking partners should have similar business models and goals.
Step 4. Analyze data
- Compare performance. Use the collected data to compare your results with those of your benchmarking partners and, if necessary, with those of the industry.
- Identify performance deficiencies. Determine where your performance can be improved and adopt the industry's best practices.
Step 5. Come up with an action plan
- Formulate gap-filling strategies. Based on the insights gained, develop ways to address the performance gaps. Outline your steps using frameworks like SMART.
Implement changes. Roll out the changes, ensuring all stakeholders are informed and involved.
Step 6. Monitor progress and refine strategies
- Track your progress. Regularly evaluate the impact of the changes you made by using set benchmarks. Adjust your strategies if needed.
- Keep updating your industry benchmarks. Update your benchmarks according to the industry's best practices.
Step 7. Repeat the process
- Review and adjust. After a set period, reevaluate your benchmark analysis to identify new areas for improvement and ensure continuous performance advancement.
- Expand benchmarking efforts. Consider extending industry benchmarking to other business areas to cultivate a culture of continual improvement and innovation.
These steps allow organizations like yours to conduct a thorough and accurate industry benchmark analysis, helping them stay competitive and prepared for market changes.

Key metrics used in industry benchmarking
Companies use external and internal benchmarking to compare their performance with the industry standards and gain valuable insights. Only you can decide what to include in your company's industry benchmark report. That said, there are quite a few essential metrics relevant to most businesses. If you're using the key performance indicators (KPIs) approach, they will likely be your industry benchmark metrics. These comparisons usually measure:
Financial metrics
- Sales revenue. The total income from sales. A baseline for evaluating market position and growth.
- Gross margin. The percentage of total sales revenue that exceeds the cost of goods sold (COGS), showing profitability per product or service.
- Net profit margin. The percentage of revenue that remains as profit after all expenses. Shows the overall financial health of the company.
Operational metrics
- Cost-per-unit. The cost efficiency of producing a unit of product. Vital for pricing and cost management.
- Time-to-market. The time it takes to move the product from concept to market. Essential in fast-paced industries, such as catering.
- Inventory turnover rate. How often inventory is sold and replaced over a period. A key metric for evaluating supply chain efficiency.
Customer-centric metrics
- Net promoter score (NPS). The likelihood of customers recommending a company to others. Measures loyalty and satisfaction.
- Customer retention rate. The percentage of customers who remain with a company over a given period. Important for assessing customer service and product quality.
- Churn rate. The rate at which customers stop doing business with you. Crucial for understanding customer retention challenges.
Market position metrics
- Share of Voice. A brand's exposure in the market compared to competitors. Often measured across digital channels to evaluate marketing effectiveness.
- SEO performance. How well your content ranks on search engines. Impacts online visibility and lead generation.
Efficiency and productivity metrics
- Labor costs and human capital ROI. The cost-effectiveness of the workforce and the return on investment in human capital.
- Sales per employee. The average revenue per employee. Provides insights into productivity and efficiency.
Industry-specific benchmarks
- Retail. Sales per square foot, warehousing costs as a percentage of revenue, and marketing costs in relation to revenue.
- Manufacturing. Cycle times, order fulfillment rates, and days sales outstanding (DSO).
- Software-as-a-service (SaaS). Customer renewal rates, billable utilization, and time to close a sale.
Strategic management metrics
- Distribution cost as a percentage of revenue. Helps companies understand the efficiency of distribution relative to sales. Used by food and beverage businesses.
- Ecommerce growth. Tracks growth in this area and highlights success in online market penetration.
When used properly, these metrics in industry benchmark reports allow companies to assess their overall performance. Companies can strategically improve their competitive advantage by identifying gaps and learning from industry leaders.
How to use industry benchmarking insights
Industry benchmark reports are business tools seeking to improve company or employee performance, refine strategies, and achieve growth. However, using these reports efficiently requires a strategic approach based on your business's needs. Below are the seven critical steps for harnessing the power of industry benchmarking analysis.
1. Define your purpose and goals
Why are you utilizing industry benchmark reports in the first place? Are you aiming to evaluate your competitiveness, identify areas for improvement, or set performance goals? Clear objectives will guide your external or internal benchmarking efforts and ensure they align with your business priorities.
2. Choose relevant and reliable industry benchmarks
Consider factors such as industry standards and market dynamics. While plenty of industry benchmarks fit most companies listed above, you should always look for those relevant in your field.
3. Analyze benchmark data
Compare industry benchmark data with your performance. Are there any trends or areas of improvement? Data visualization with charts and dashboards can help comprehend the information and identify actionable insights.
4. Interpret results and identify gaps
Determine the leading causes behind any disparities, such as operational inefficiencies, positioning, or other reasons.
5. Find actionable solutions
Devise strategies to address identified gaps and capitalize on your strengths. Formulate precise action plans aimed at improving performance and competitiveness.
6. Implement and monitor progress
Continuously track your progress against industry benchmarks and make adjustments to stay on track. Regular performance reviews are critical for refining strategies and responsiveness to market changes. Coresignal's webhooks automatically notify you the moment a tracked data field changes, so your benchmarks always reflect the latest market reality.
7. Adapt and innovate
Treat industry benchmarks as guides rather than universal standards. Adapt them to suit your business and leverage them to drive innovation. Maintain your flexibility, and don't be afraid to experiment to stay ahead of the game.
Final thoughts on industry benchmarking
Industry benchmarking analysis is a powerful tool for improving performance and enabling strategic decision-making in business. By adopting a systematic approach and leveraging reliable real-time industry data, companies like yours can gain insights, revamp operations, and reach sustainable growth. As markets continue to shift, benchmarking will become even more important for businesses that want to stay agile, spot emerging opportunities early, and adapt with confidence.
There are three main reasons why strategic benchmarking is beneficial for businesses. First, it gives investors insights into your company's potential, helping build their trust. Additionally, it identifies opportunities for growth and helps set strategic goals. Lastly, regular business benchmarking lets you make timely adjustments and maintain focus on the company's goals.
With access to fresh public web data from Coresignal, businesses can benchmark more accurately against the market, monitor changes as they happen, and turn industry signals into a forward-looking strategy.