
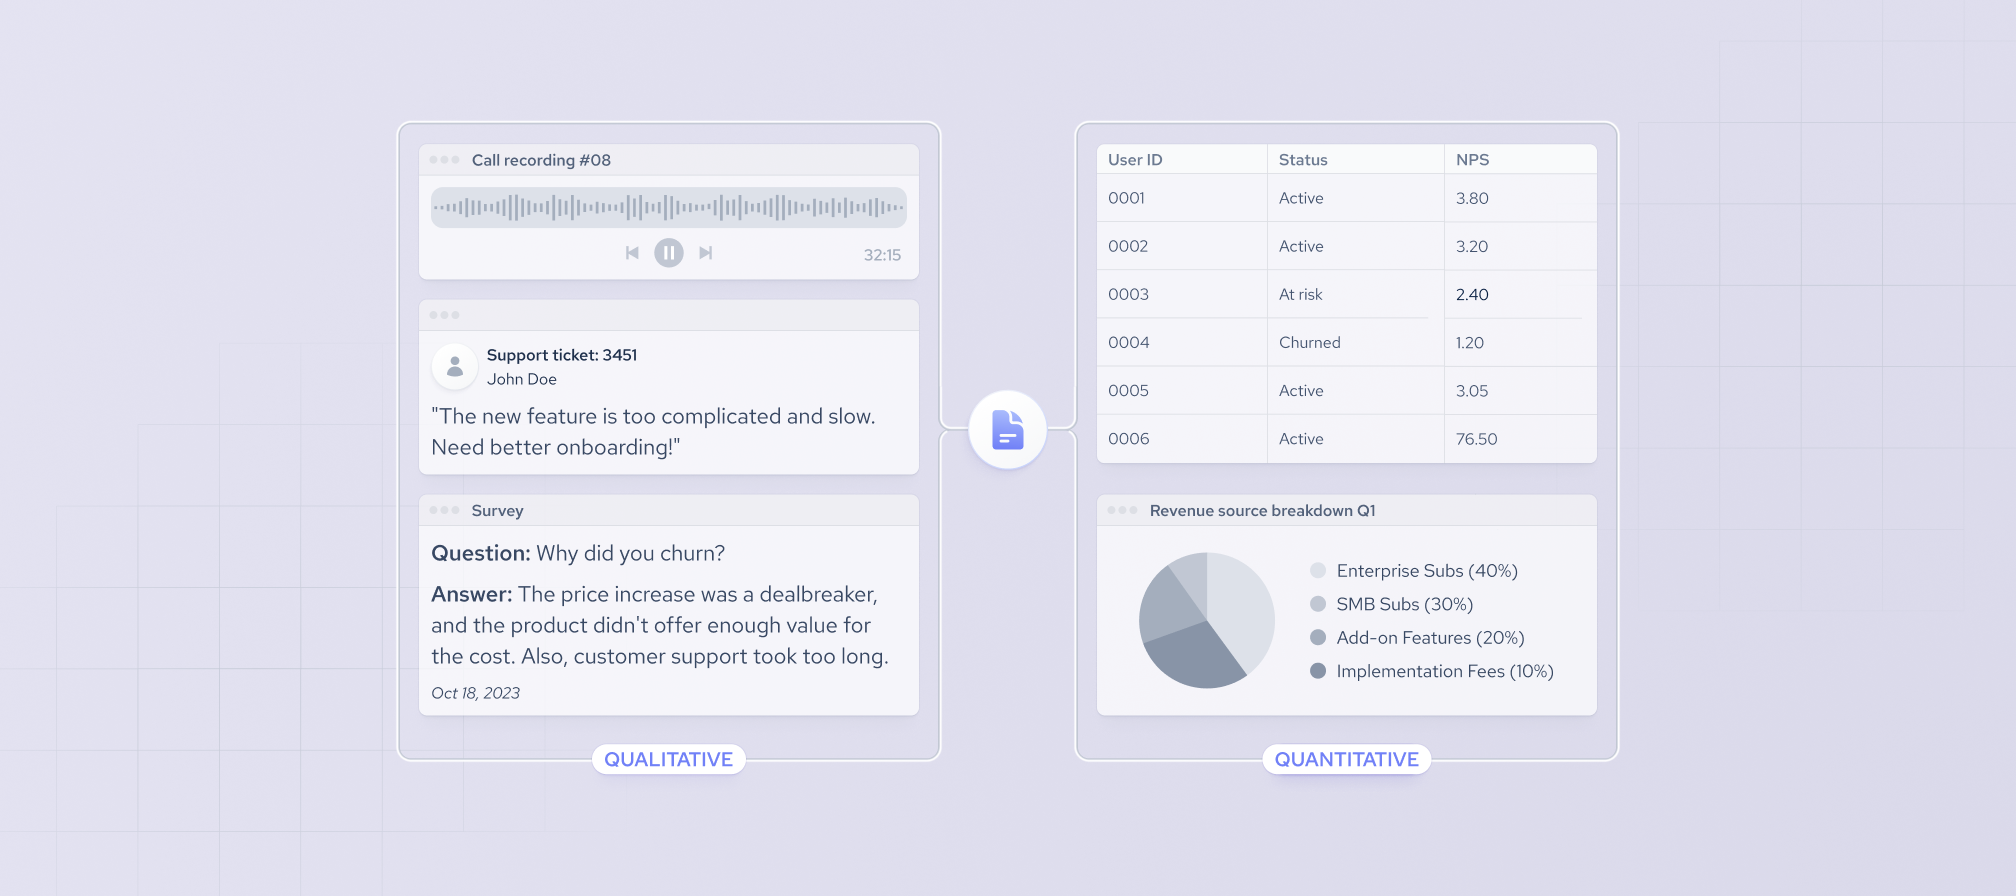
Qualitative data is non-numerical, usually unstructured textual information used for qualitative research methods, and aims to answer the question of why. For example, it could be product reviews, company employee reviews, surveys, and more. Quantitative data is numerical data that can be displayed in graphs and charts and supports quantitative research methods. This type of data shows numerical values such as company revenue, headcount, funding amount, and more. Quantitative research aims to answer the question of what.
Other types of data include numerical, discrete, categorical, ordinal, nominal, ratio, and continuous, among others. However, all data types fall under one of two categories: qualitative and quantitative. Whether you are comparing qualitative vs quantitative data to analyze customer sentiment or measure sales performance, choosing the right type can make or break the accuracy of your research.
In this article, I will focus on web data and provide a deeper understanding of the nuances of qualitative vs quantitative data, and web data types.
What is the difference between qualitative and quantitative data?
The easiest way to understand the difference between qualitative and quantitative data is through examples. Qualitative data describes characteristics, categories, or attributes, while quantitative data represents measurable numerical values. The table below shows common examples of quantitative vs qualitative data:
What is qualitative data?
Qualitative data refers to interpreting non-numeric data. It is often unstructured or semi-structured, and perhaps one of the easiest ways to identify it is that it does not come as numbers.
In other words, to understand what is qualitative data, it refers to information that describes certain properties, labels, and attributes, capturing characteristics and qualities that cannot be expressed as numbers.
Qualitative methods are often known as investigative as they can be used to answer the question why using open-ended questions. It helps create a story, develop hypotheses, or obtain an initial understanding of a case or situation.
Sources of qualitative data
Qualitative data is generated via numerous channels, such as company employee reviews, in-depth interviews, and focus groups, to name a few.
This type of web data often comes in an unstructured form and is often difficult to collect and analyze.
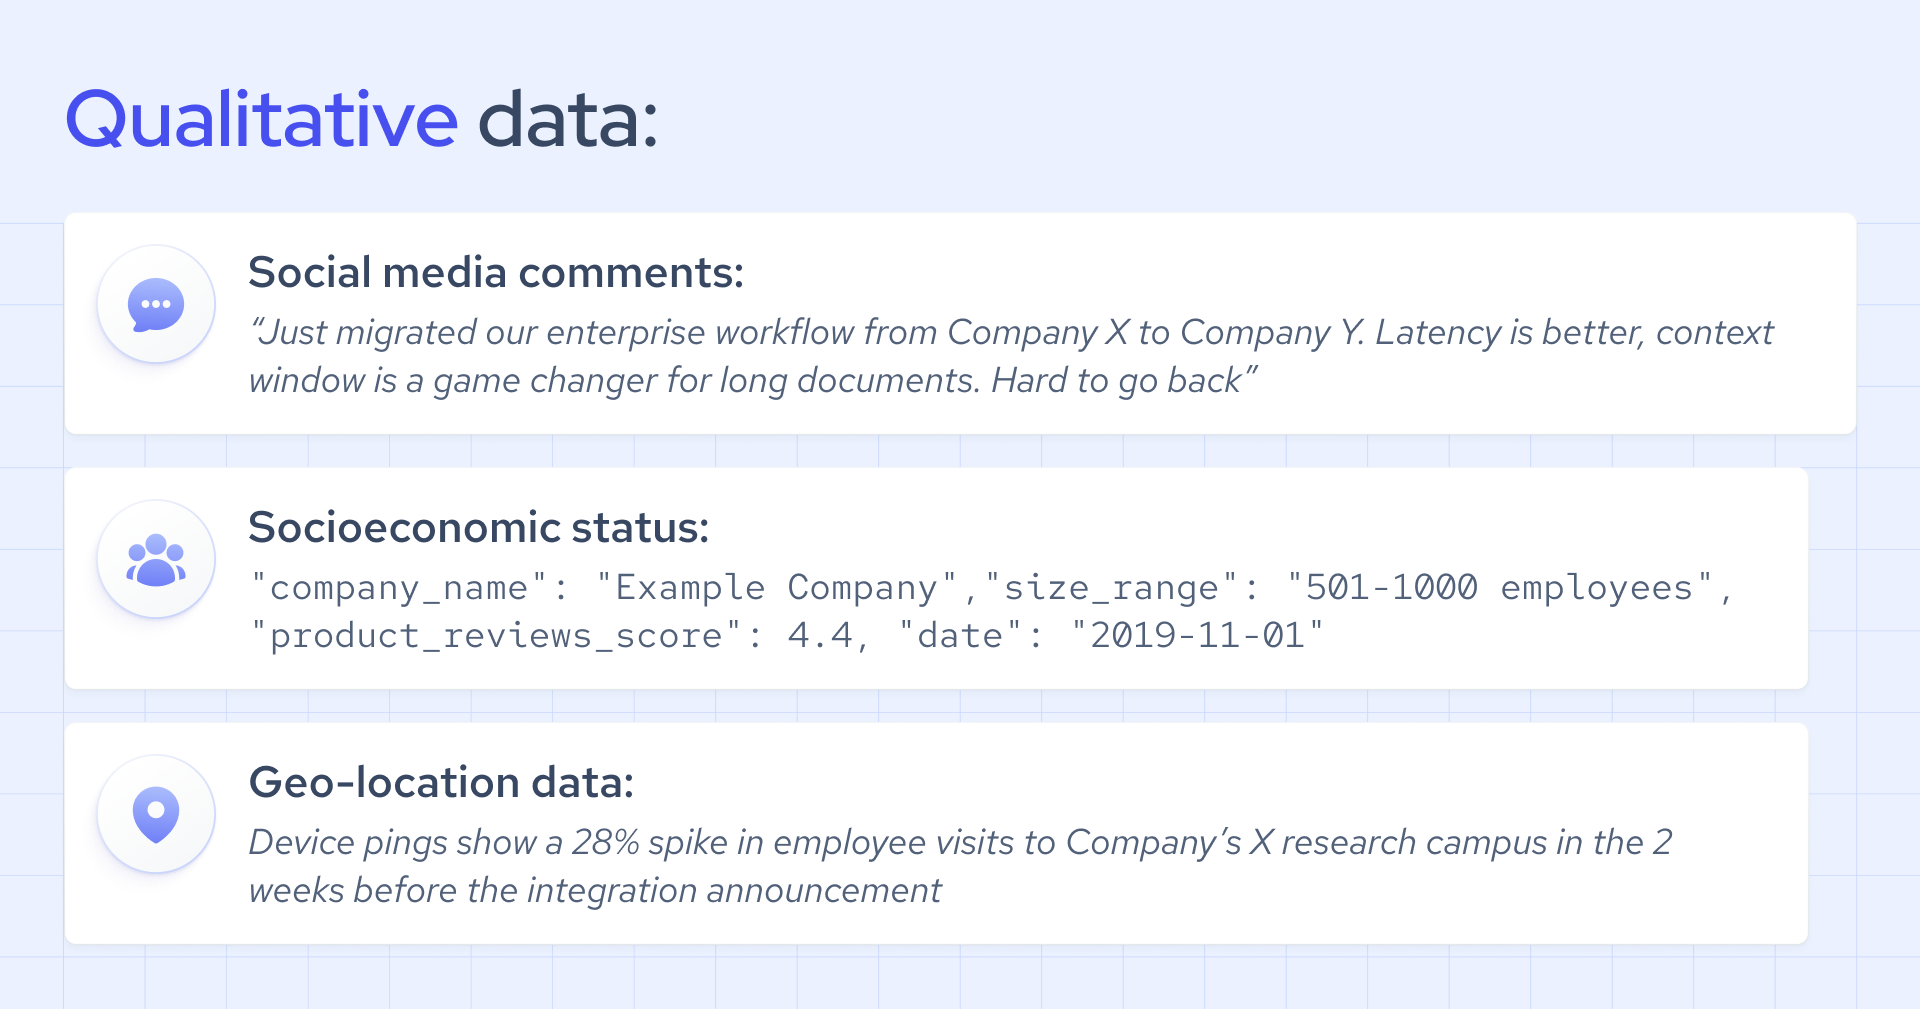
Some examples of qualitative web data include information collected from social media, search engines, product reviews, comments, or other web interactions.
Interested parties can collect this data directly from the source (i.e., social media platforms) or utilize web data providers.
The benefit of choosing a data provider is that the information is already selected and presented in an easy-to-understand format, rather than collecting all the data available on all social media platforms or search engines. With a real-time data provider like Coresignal, that advantage goes further, because qualitative signals are not just structured and ready to use but are also updated as the market changes, so you're never making decisions based on sentiment that no longer reflects reality.
For example, with company employee review data, you can see the internal environment of a company and identify potential risks. The reviews are written by employees who work in the company, therefore it helps you assess the internal situation. If the reviews are negative, it might indicate problems in the company and make you think twice about investing in it.
On the other hand, if the reviews are positive and the employees are happy to work there, it indicates that the company takes care of its employees. As a result, it might solidify a potential investment opportunity.
Examples of qualitative data
Qualitative data examples that might interest investors and businesses are extremely varied. These depend on your objectives, the scope of the research project, and the purpose of your data collection.
For instance, if you want to invest in a business, you may be interested in the comments on social media that mention the company's products and whether the review is positive or negative.
Alternatively, a company trying to gain an insight into their competitors might seek the same information or may want to find out the socioeconomic status of their clients.
Another source of qualitative data when it comes to web data is sensors. This refers to information collected from CCTV, POS, satellites, geo-location, and others.
This data collection is facilitated via the interconnectivity of devices. It could indicate, for instance, the foot traffic at the competitor's business location.
Types of qualitative data
Categorical data
As briefly mentioned above, some data types refer to the same information. In statistics, qualitative data is the same as categorical data. This is because this information can be easily categorized based on properties or certain characteristics.
The main feature is that qualitative data does not come as numbers with mathematical meaning, but rather as words. In some cases, qualitative data may be assigned numbers (1 or 0, for instance) for analysis purposes.
For instance, if you conduct a questionnaire to find out the native language of your customers, you may note “1” for English and “0” for others.
However, these numbers have no meaning from a mathematical perspective; similarly, if you check the ZIP codes of your clients, the data remains qualitative because the ZIP code numbers do not have any mathematical meaning; they only indicate your customers' addresses.
Categorical data can be further split into nominal or ordinal data.
- Nominal data refers to information that cannot be sorted in a given way – you can assign categories to these data, but you cannot order them, for instance, from the highest to the lowest. For example, information collected through closed questions, such as "Would you recommend this product?" The answers collected can be split into “yes” or “no”, but you cannot further organize them. Nominal data helps you calculate percentages, such as 50% of comments on social media were happy with the company's after-sales service, proportions, or frequencies.
- Ordinal data lets you assign categories to qualitative data and order them logically. Let's assume you have a B2B company that wants to collect information about its clients. You can obtain firmographic data indicating each client's company size, then assign each client to small, medium, or large categories. Unlike information with “yes/no” answers, these categories can be logically ordered from small to large. You can also assign numbers to ordinal data, but these numbers have no mathematical meaning. Thus, ordinal data remains qualitative. For example, if a questionnaire asks customers to rate product quality from 1 (“poor”) to 5 (“high-quality”), your ordinal data fits these categories and numbers.
Benefits of qualitative data
Qualitative data helps you understand the reasons behind certain phenomena. For example, you notice that your competitor's revenues are 50% higher than yours. The quantitative data, such as revenue numbers, does not help you understand why the company performs much better.
The right qualitative data can help you understand your competitors, helping you adjust your own competitive strategy to stay ahead of your competition.
For example, you can use data collected from sensors to identify the foot traffic at your competitor's location. In this case, you may find out that they have more customers than you do, which explains the revenues.
Alternatively, you may find the same amount or fewer customers, which may mean that they charge a premium for their products and services.
Some other benefits and applications of such web data include:
- Fine-tuning marketing strategy by collecting ideas or opinions from social media platforms;
- Look for ways to attract new customers;
- Obtain a granular insight into a business or your chosen target audience;
- Stay on top of the competition by becoming familiar with other companies' business strategies, strengths, and weaknesses;
- Obtain detail-oriented data to inform investment or business decisions.
- Real-time quantitative data can be acted on immediately, turning market signals into decisions before your competitors see the same trends.
When to use qualitative data?
According to Sage Journals, qualitative research is best when:
- The goal is to collect data about a product's or service's satisfaction between users. It can help improve your product intelligence and find weak spots that can be improved;
- You need to understand people’s experiences, perspectives, meanings, and context, not just counts or averages;
- You want in-depth, human-centered insights into behaviors, interactions, or lived experiences;
- You are exploring a new, poorly understood, or evolving situation and need openness and flexibility in data collection;
- You need to examine motivations, perceptions, and meanings, such as why consumers behave a certain way in a new market;
- You want findings grounded in real-world issues and lived experience, especially for policy, practice, or stakeholder understanding, or
- You want to develop theory or build a deeper conceptual understanding before measuring something quantitatively.
What is quantitative data?
The second major type of data is quantitative. As the name suggests, it is data in numbers with mathematical meaning that indicate quantities of specific aspects. For example, a company's financial reports contain quantitative data. The main benefit of quantitative data is that it is easier to collect, analyze, and understand than qualitative data.
One can easily visually represent what is quantitative data with various charts and graphs, including scatter plots, lines, bar graphs, and others. You can also collect quantitative data to calculate ratios, for instance, if you want to compare a company's performance or study its financial reports to make an investment decision.
Sources of quantitative data
Quantitative data comes from a wide range of sources. You may use market reports, conduct surveys, or collect web scraped data that can be transposed into numbers with certain values. All of this data share one thing in common: they produce numbers that can be counted, measured, or statistically analyzed. Surveys and questionnaires with closed-ended questions, experiments and laboratory measurements, clinical and scientific measurements. Structured observations record how often or how long certain behaviors occur, while tests and assessments, such as exams or standardized tests, yield scores that can be ranked and compared across individuals or groups.
Beyond these research-focused sources, quantitative data is also embedded in everyday systems and institutions: administrative records from schools, hospitals, and companies; government databases and census data; and financial records covering sales, revenue, and expenses all generate vast quantities of numerical information.
Technology adds further sources: sensors and devices such as GPS trackers, wearables, and temperature monitors continuously collect measurements, while web and app analytics capture user behavior through metrics like clicks, visits, and conversion rates.
In short, wherever something is counted, timed, scored, or recorded in numerical form, quantitative data is being produced.
Examples of quantitative data
Quantitative data appears in almost every area of life, wherever something can be expressed as a number. Some quantitative data examples include credit card transactions, sales data, financial report data, macroeconomic indicators, employee counts, job postings, and more. In business and economics, quantitative data includes monthly income, sales revenue, and the number of products sold, while in education, it might refer to the number of students in a class. Environmental and logistical factors, such as temperature and distance traveled, also fall into this category, as do digital metrics, such as the number of website visits.
Types of quantitative data
There are 2 types of quantitative or numeric data: discrete and continuous. As a general rule, counts are discrete, and measurements are continuous.
Discrete data refers to certain types of information that cannot be divided into parts. For example, a company cannot have 15.5 employees – it's either 15 or 16 employees. In simple words, discrete data can take only certain values and cannot include fractions.
On the other side, continuous data can be divided into fractions and may take nearly any numeric value. For instance, a company's net profit of $100593,74 is continuous data. The same happens with the financial information of a company, such as sales data, credit card transactions, and others.
Benefits of quantitative data
Quantitative data is easy to interpret and can be collected easier because of its form. Some of the main benefits of collecting quantitative data depend on the type of information you seek. For instance, firmographics, or firm-specific data, allows you to have a quick glance at your competitors' size, employee numbers, and others.
Some of the main benefits of quantitative data include:
- Easier and quicker to collect. Structured formats, such as surveys or automated tracking systems, can gather large amounts of information, making data collection faster and more efficient.
- Objectivity and accuracy. Quantitative data, expressed in numbers, is less susceptible to personal bias or interpretation. Standardized research frameworks ensure results are consistent and replicable, strengthening the transparency and trustworthiness of findings.
- Easier to categorize, organize, and analyze. Numbers can be sorted, grouped, and processed without the interpretive work, making it straightforward to spot patterns and draw conclusions.
- Capacity for larger data samples. Digital tools and automated systems collect responses or measurements at scale without a proportional increase in cost or time, enabling work with much larger datasets.
- Compatibility with statistical analysis and AI-based processes. Quantitative data works seamlessly with statistical methods and machine learning tools, which rely on numerical inputs to identify patterns, make predictions, and generate insights.
- Provision of detail-oriented data for decision making. The precision of quantitative data, from sales figures and conversion rates to operational metrics, makes it highly valuable for guiding investment strategies and business decisions with confidence.

When to use quantitative data?
Use quantitative data when:
- You want to measure something. Whether it is performance, behavior, or output, quantitative data provides the precision needed to achieve accuracy;
- You need to determine how many, how much, or how often, quantitative data provides clear, countable results to answer these frequency and magnitude questions;
- You want to compare groups or variables. Quantitative data makes it straightforward to compare different groups, time periods, or conditions using consistent, numerical benchmarks;
- You need percentages or averages. When your analysis requires summary statistics such as percentages, means, or ratios, quantitative data provides the structured input needed to calculate them.
- You want to use statistics. Quantitative data is the foundation of statistical analysis, enabling you to identify patterns, test hypotheses, and draw evidence-based conclusions;
- You need results that can be generalized to a larger population. Because quantitative data can be collected at scale, it supports findings that are representative and broadly applicable beyond the immediate sample, or
- Your goal is objectivity and precision. For example, when you want to find a list of ideal companies, taking into account many contributing factors from funding rounds and amounts to the number of social media followers.
Similarities between qualitative and quantitative research
Despite their differences, qualitative and quantitative research share several important commonalities.
- Both research types require raw data;
- Both are used to measure results;
- Sometimes one type of research complements the other.
Differences between qualitative and quantitative research
The difference between qualitative and quantitative research lies in their approach, structure, and output. While both are valuable tools for gathering insights, understanding their distinctions is essential for choosing the right method for your research goals. Here are the key differences between the two:
- Qualitative researchers seek non-numerical information, quantitative researchers analyze numerical data.
- Qualitative research is harder to draw results from because of unstructured data, whereas quantitative data is more structured.
- Qualitative research is based more on subjective views, whereas quantitative research shows objective numbers.
- Quantitative data allows for both inferential statistics and descriptive statistics, whereas with qualitative data you can only do descriptive to a limited extent.
When exploring quantitative vs qualitative methods, it is clear that each approach serves a distinct purpose depending on the research question at hand.
Regardless of which research type you use, the freshness of your data determines the reliability of your conclusions. Acting on data that is even slightly out of date can lead to missed opportunities or, worse, to decisions based on a market that no longer exists. This is why sourcing real-time data is just as important as choosing the right research method. Coresignal provides real-time company, employee, and jobs data so that both your qualitative and quantitative research reflect the market as it stands today.
Choosing between qualitative and quantitative data
Analyzing quantitative vs qualitative data reveals that while each has distinct roles, the two are most effective when used together to provide a complete picture of your research. Each answers different research questions. Quantitative data offers numbers and statistical insights to identify trends, while qualitative data explains the experiences and motivations behind them. Qualitative research often emphasizes social context and detailed participant feedback, helping businesses better understand their audience and personalize their offerings.


