A major concern today, fueled by progress in AI, is that entry-level positions and internships will become obsolete. Studies, such as those from Indeed Hiring Lab and Higher Education Today, point to a market where landing an internship and starting a graduate career is harder than ever.
To look into the topic, we analyzed more than 4 million internships across every U.S. state from 2023 to the first half of 2026. We didn’t look at internship postings, which don’t accurately reflect changes in the workforce. Instead, we analyzed internships that individuals publicly reported holding on their professional profiles. This article covers what we found about how the internship market has shifted since the rise of AI.
Islands of growth in a sea of decline
This study uses ethically sourced, publicly available multi-source employee data from 2023 to July 2026. Note that 22.3% of internships didn’t list a company state, and 15.4% of interns didn’t list their internship state. We excluded these records from all state comparisons. Even so, each comparison still includes more than 3 million internships.
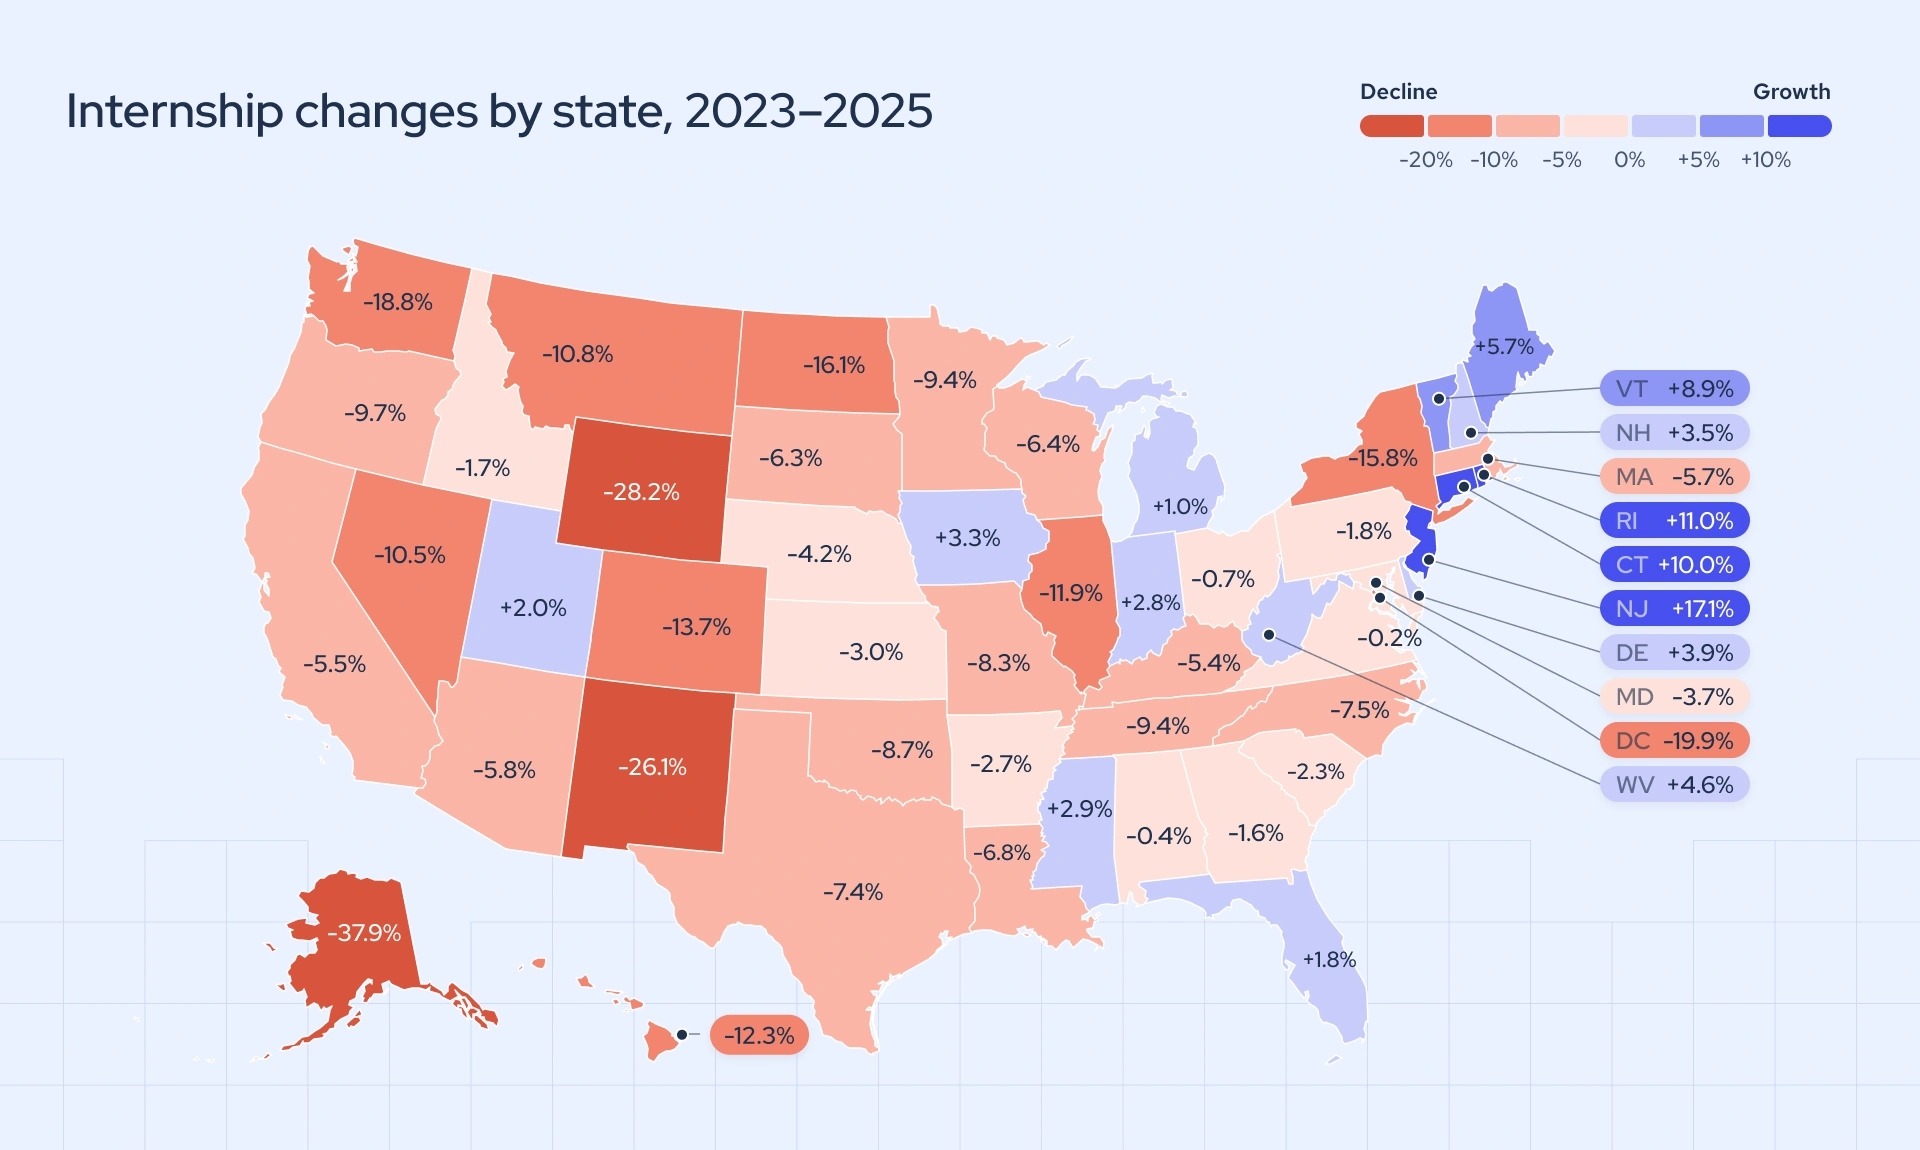
Even though several major generative AI tools launched between 2022 and 2024, the data shows no noticeable change in internship numbers from 2023 to 2024. In fact, internships across all 51 U.S. jurisdictions (the 50 states and the District of Columbia) rose by 1.1%. The largest increases were in New Jersey (+13.6%), Mississippi (+11.3%), and Vermont (+10.9%). The steepest declines were in Alaska (-16.1%), North Dakota (-9.8%), and New Mexico (-7.3%). Overall, internships grew in 34 of 51 jurisdictions from 2023 to 2024.
The situation changed sharply from 2024 to 2025. After rising 1.1% the year before, internships across all 51 U.S. jurisdictions fell by 7.5%. Internships rose in only three jurisdictions during this period: New Jersey (+3.1%), Rhode Island (+1.0%), and New Hampshire (+0.4%). Meanwhile, the steepest declines were in Wyoming (-27.8%), Alaska (-26.0%), and New Mexico (-20.3%).
If we are to look at the entire 2023–2025 period, internships were in net growth in 14 out of 51 jurisdictions, with a general -6.4% decline.
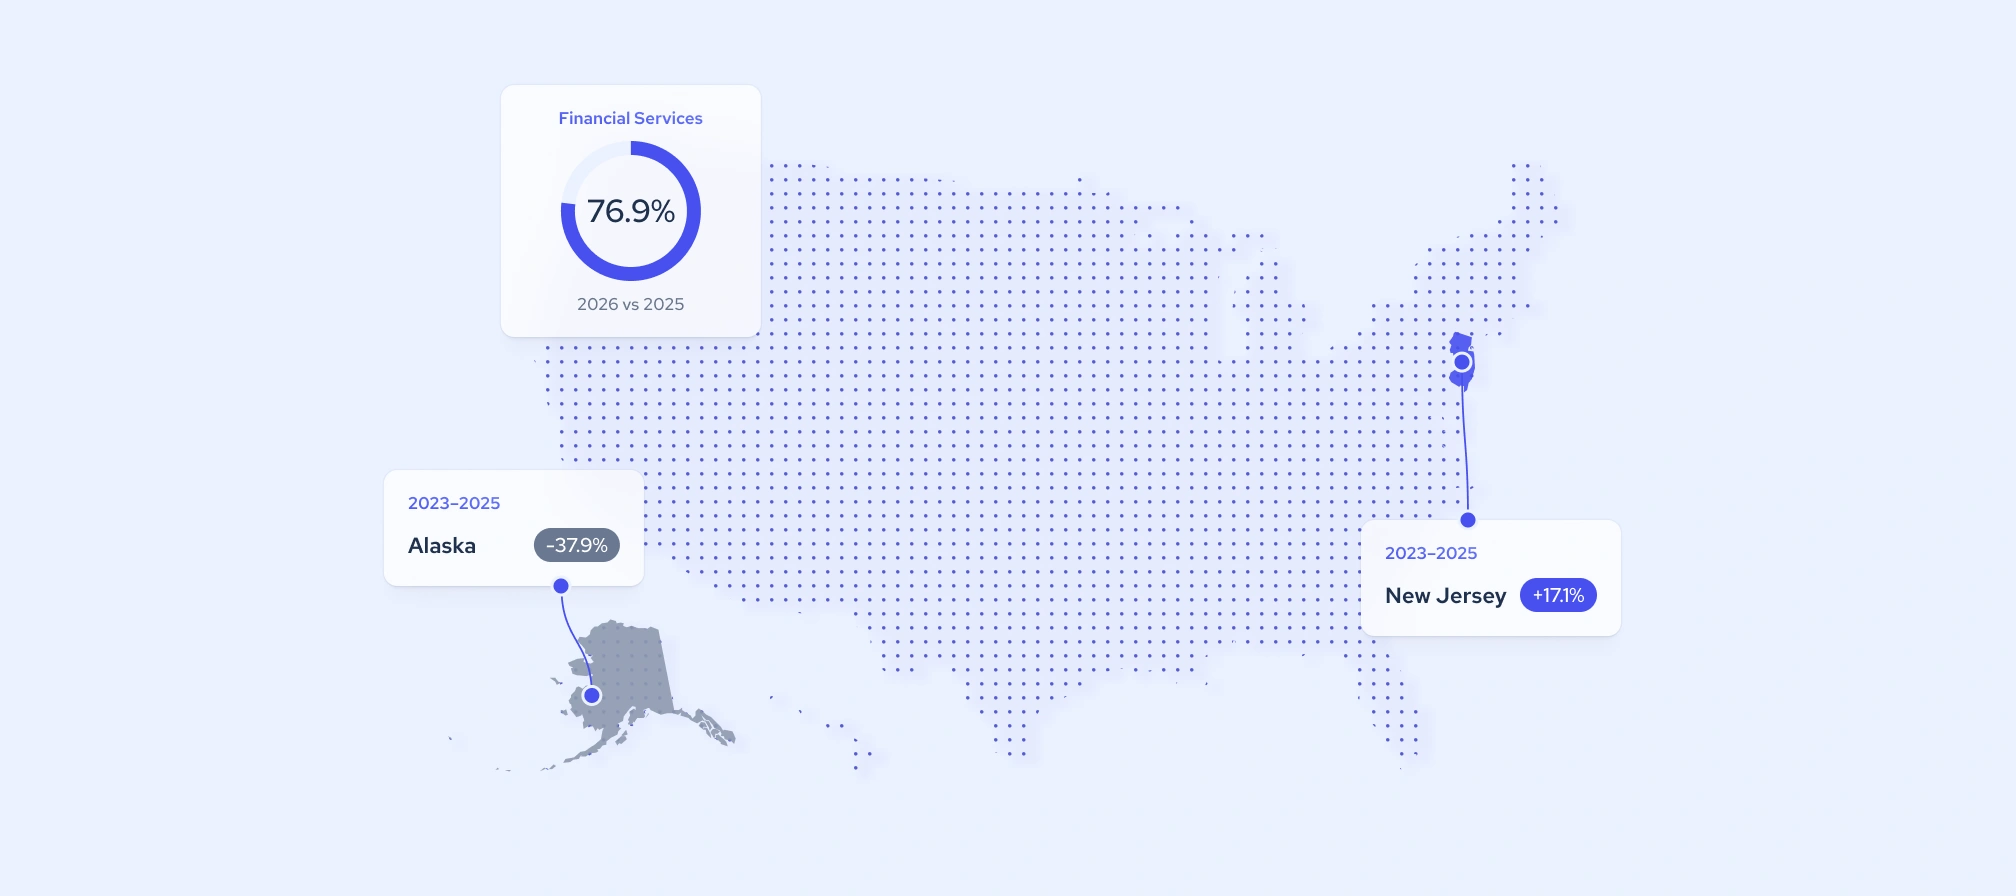
Note: the table shows the change in the number of internships between 2023 and the first half of 2026 for the states with the highest and lowest growth, based on interns’ data.
Top states for internship availability
The numbers differ slightly depending on whether we use company data or employee data. Combining the two is difficult for two reasons. First, not every internship is in the same state as the company’s listed headquarters. Second, the state an intern lists doesn’t always refer to the internship itself, since some interns list their general professional location instead. That’s why we split the following data into two parts: the 10 largest states based on company data and the 10 largest states based on locations publicly listed by interns.
Top 10 states for internships by company location
Unsurprisingly, jurisdictions with the highest population also offer more internship opportunities. However, it’s useful to look at where the majority of the internship-offering companies have their headquarters in. Unlike elsewhere in the article, this information is based on company, rather than employee data.
Top 10 states based on employee data
There could potentially be two main reasons why these numbers differ from the company-based data. First, public data doesn’t always distinguish between an intern’s home state and professional state. This includes remote internships, where the intern’s location doesn’t match the company’s location. Second, employee data has fewer records with no state listed than company data, so it naturally leaves more records to compare. In total, 84.6% of records in the employee data list a state, compared to 77.7% in the company data.
Florida and New Jersey stand out as the only U.S. jurisdictions with net positive growth out of the top 10 states. Florida is simple to explain: its growth from 2023 to 2024 outweighed its decline from 2024 to 2025, which left a net gain. New Jersey is less straightforward. Company data shows a net decline of 1.2%, but employee data shows continuous growth. This could reflect interns based in New Jersey working remotely for companies in other states. It could also point to people crossing state lines for internships, particularly into New York.
Financial services and real estate internships are on the rise
We analyzed 85.4% of records that listed an industry. These records covered 242 industries, and this section focuses on the 12 largest by internship volume (based on employee data). Among them, financial services, construction, spectator sports, and real estate are the only industries with steady growth. Meanwhile, higher education and health care saw sharp declines.
Note: the spectator sports industry includes organizations that host live sporting events for an audience, from event organizers to venue operators.
Across nearly all the data, one pattern holds: internships declined from 2024 to 2025. Declines from 2023 to 2024 were far less common, and the 2024-2025 drop often pushed net growth below zero. Comparing only 2024 and 2025 would show even larger declines, particularly in government administration.
Several industries outside the top 12 also declined, including motor vehicle manufacturing (-16.6%), retail (-12.3%), architecture and planning (-10.1%), and defense and space manufacturing (-9.9%).
Leading employers: where internship numbers rose and fell
A few companies stood out in internship numbers. Among the top 10 intern employers, Amazon had the highest net growth at 23.7%. It’s also one of the few employers where internships in 2025 exceeded 2023 levels. Meanwhile, several large accounting and consulting firms saw notable declines.
Note: information here is based on Coresignal’s multi-source employee data.
Among the Big Five technology companies, Amazon and Meta (+52.7%) saw net growth in 2025. Microsoft and Google saw net declines from 2023 to 2025. Google’s numbers partly recovered in 2025, while Microsoft’s continued to fall. Several accounting and consulting firms, which run some of the largest internship programs in the U.S., also saw significant declines.
Several large defense, aerospace, and automotive employers also saw significant declines since 2023, including Boeing (-54.5%), Northrop Grumman (-43.6%), Tesla (-40.5%), and Lockheed Martin (-33.0%). In contrast, internships at government bodies, such as the U.S. House of Representatives and the Senate, remained relatively stable.
What first half of 2026 shows
Because we only compared full calendar years across states, industries, and employers, we excluded 2026 from those comparisons. However, the first half of 2026 still shows some interesting patterns. From January to July 2026, there were already more than 600,000 confirmed internships, compared to 1.05 million in all of 2025.
According to employee data, among the top 10 employers, Google had the highest share, reaching 89.1% of its 2025 internship total in the first half of 2026. KPMG US followed closely at 87.1%. By state, New Hampshire (68.0%) and Virginia (67.6%) have already passed two-thirds of their 2025 totals. Comparing all – employers, states, and industries – Higher Education is the only field that was below 50% of the 2025 total in the first half of 2026.
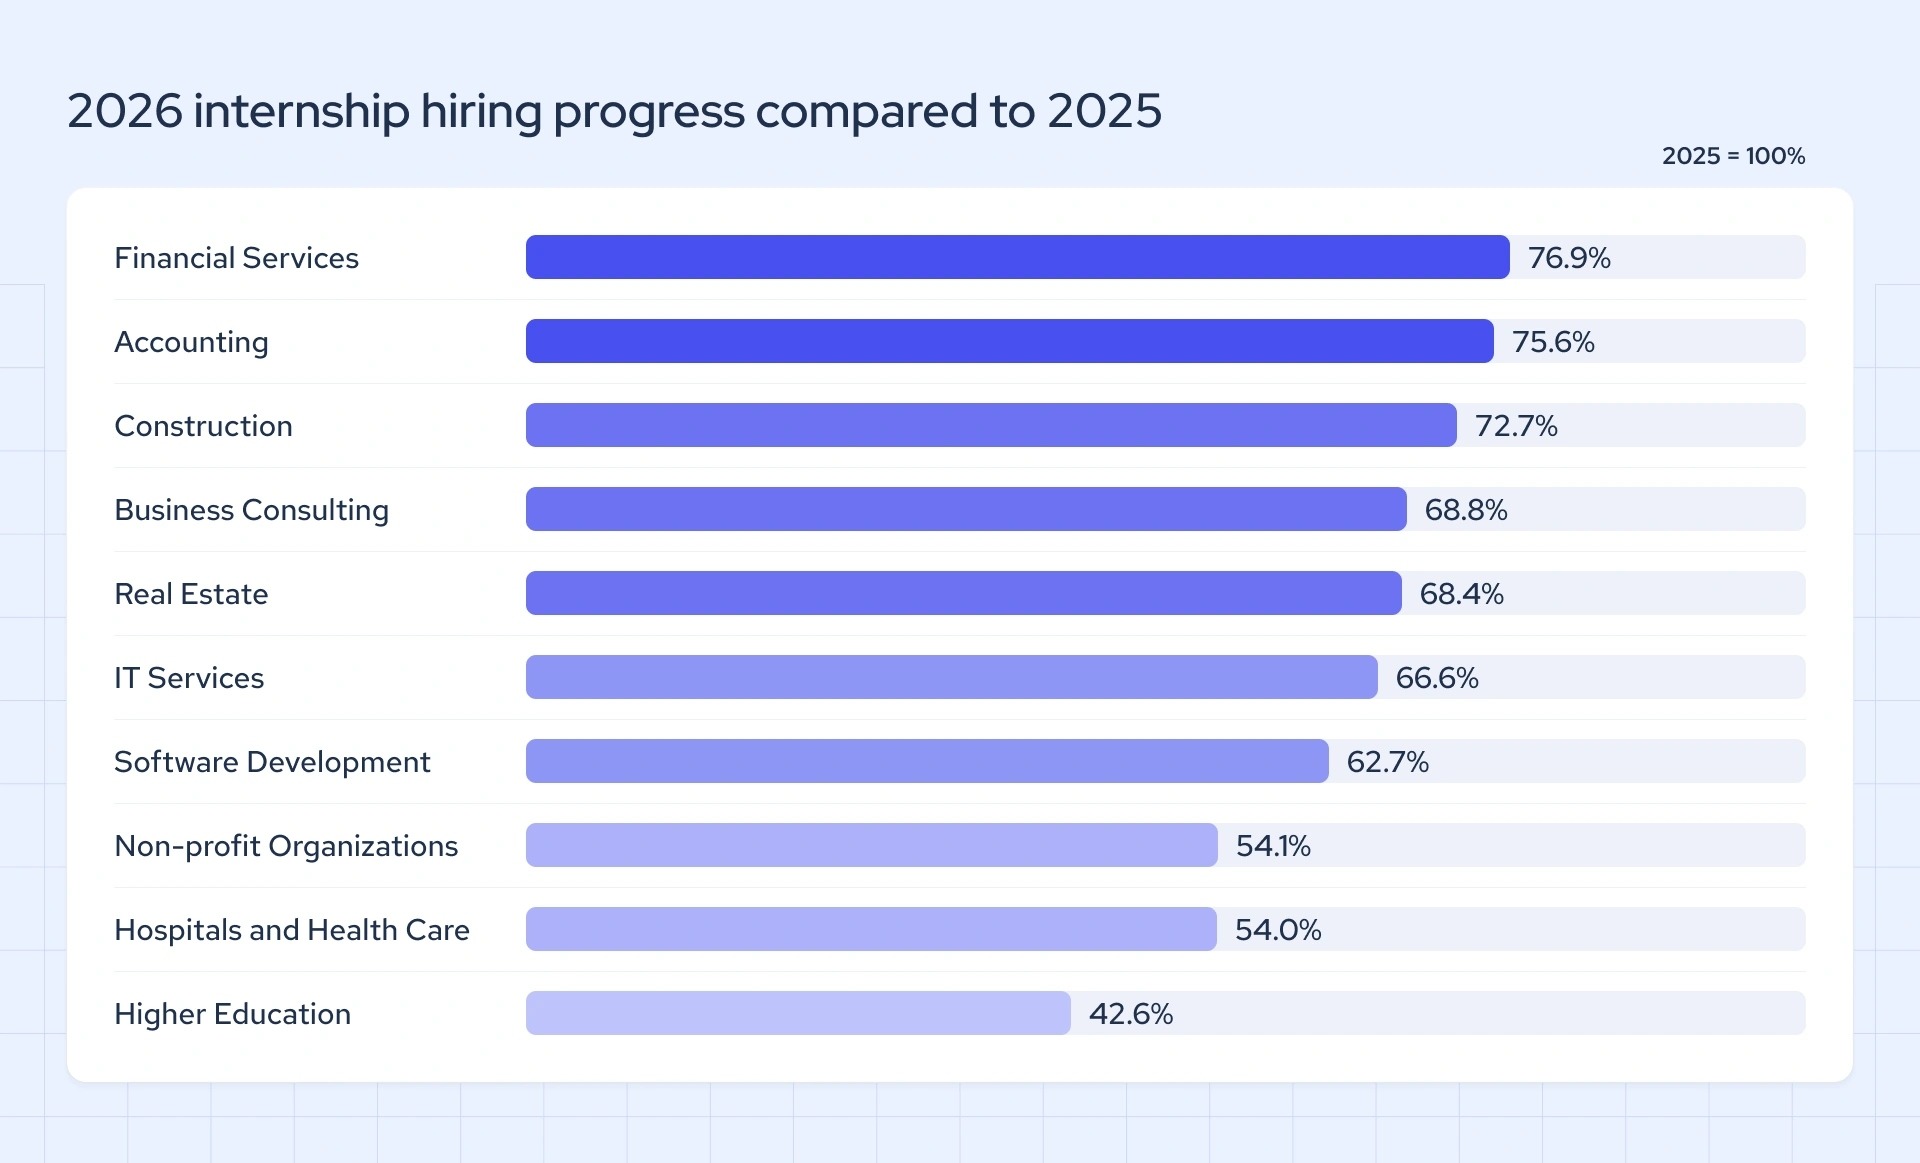
Although 2026 net total has already passed half of 2025 results, this doesn’t necessarily mean internships will grow this year. Internship numbers can depend on factors such as seasonality, specific events or projects, and election cycles. And even though we are already at the Q4 of 2026, not everyone has already listed their internships (and not all internships are yet completed).
Bottom line
We analyzed more than 4 million genuinely filled U.S. internships from 2023 to the first half of 2026 to see how the market has shifted since the rise of AI. Internships rose 1.1% from 2023 to 2024, then fell 7.5% from 2024 to 2025, for a net decline of 6.4%. Only 14 of 51 U.S. jurisdictions saw net growth, and even with these exceptions, the overall trend points downward. Early 2026 data looks promising for many industries, but we won’t know until 2027 whether it reflects a strong first half or a lasting recovery.
Methodology
- This study is based on Coresignal’s clean, multi-source, publicly available company and employee data from January 2023 to July 2026. We analyzed 4,013,610 records, and more than 3.1 million of them were used for comparisons across U.S. jurisdictions.
- We only analyzed U.S. internships with job titles that included terms such as “intern,” “internship,” or “co-op.” We excluded titles that contained “virtual experience,” “job simulation,” “bootcamp,” or “training academy,” since these often refer to programs that aren’t internships.
- We counted different spellings and abbreviations of a state as the same state. For example, “Texas,” “texas,” and “TX” all counted as Texas.
- Because some internships span more than one calendar year, we assigned each internship to the year it started and compared results year over year.
- Because remote internships and internship locations don’t always match a company’s listed location, we compared public data from both companies and employees.
- We excluded more than 70,000 records of interns based outside the U.S., since this study only covers U.S. internships.
- We excluded 2026 from all year-over-year comparisons because it only includes part of the year. We also excluded the most recent months, such as September and October, because many recent internships haven’t been publicly listed yet.
- The number of internships differs between employee and company data, mainly because about 200,000 more employee records list a state. This doesn’t mean one source is more accurate than the other; the results simply depend on which source is used.