

According to Gartner’s February 2026 forecast, worldwide IT spending will reach $6.15 trillion in 2026, representing a whopping 10.8% year-over-year increase. As AI infrastructure powers increasingly evolving technology stacks, understanding which software and tools your competitors and potential clients are using is no longer optional.
Technographic data provides those exact insights. It has become an instrumental tool for sales, marketing, investment, and market intelligence teams, who use it to identify potential customers, conduct competitive intelligence, and find investment opportunities based on a company’s technological strengths and weaknesses.
In this guide, I’ll dive deeper into technographic data and answer the most common questions I’ve been asked about it while working with data-driven teams and large-scale datasets at Coresignal.
What is technographic data?
Technographic data, or technographics, encompasses all information about a company’s current technology stack, including which technology the company currently relies on, how it's used (e.g., for building its website, product, or accounting software), and when it was acquired.
This type of data goes beyond simple lists; it tells a lot about how a company actually operates on a day-to-day basis. For instance, knowing that it uses Salesforce, HubSpot, AWS, and Slack reveals a level of infrastructure maturity and signals priorities that firmographics alone simply can’t provide.
How is technographic data different from firmographic data?
Firmographic data describes what the company actually is. This information typically includes attributes such as industry, location, number of employees, revenue, and ownership, all of which are crucial for prospecting, building ideal customer profiles (ICPs), and boosting sales.
Technographic data defines a company by the technologies it uses, including hardware, software, software-as-a-service (SaaS), and cloud infrastructure. As such, it answers how a particular business operates.
That distinction matters a lot when go-to-market (GTM) teams choose who to target. Most GTM efforts start with firmographics that define ideal customer profiles (ICPs) and then combine them with technographics, which allows you to further filter companies within those profiles based on the tools they use.
What is typically included in a technographic dataset?
In my experience, a technographic dataset worth your while includes information that gives you a complete picture of an organization’s tech stack, including:
- Technology names: The exact software tools in use, such as HubSpot, Salesforce, Slack, and Kubernetes.
- Categories: Groupings that indicate the tools’ functions, like accounting software or payment gateways.
- Infrastructure details: Information about an organization’s cloud hosting or server setup.
- Adoption signals: How a tool is implemented, including indicators like first-detection rate and last-confirmed date.
- Usage context: Details about the role the tool plays within an organization’s workflows, like data warehousing or payment processing.
Raw data doesn’t do much, either, because it can be challenging to use in downstream models. In that sense, a high-quality technographic dataset should structure and standardize all data across multiple key fields.
How is technographic data collected?
As technographic data isn’t freely available on a company’s website, it can be helpful to purchase that information from a technographic data provider.
Most reputable vendors go beyond single-source data collection because it doesn’t tell the full story. Instead, they combine multiple sources to boost accuracy and coverage and regularly rely on scraping, structuring, and enriching publicly available data.
- Web scraping: Getting information from the publicly available sources, such as professional networks, company websites or specialized tech stack directories, provides vendors with a comprehensive data of the tools a company is currently using. Top-tier vendors like Coresignal regularly scrape job posting data for real-time insights.
- Data structuring and cleaning: Once the information is collected, a provider will work to structure, deduplicate, and clean the data for easier use. This step is especially important when integrating data from multiple sources. If you have tech stack information from different platforms, you will need a way to connect it to the same company. This is why having unified company IDs and detailed metadata is extremely important.
- Data enrichment. In many cases, extracting tech stack information would include natural language processing (NLP), as technologies might be listed in text-heavy job posting or company descriptions. Manually extracting tech stack would not be scaleable here, so automation is essential.
What are the top technographic data providers in 2026?
Having spent years in the industry, I know that defining a single best technographic data provider isn’t exactly possible, as it all depends on your use case.
Fortunately, the B2B technographic data landscape is filled with vendors that cater to different needs. Some rely solely on web scraping, while others employ multi-source data collection. Some serve enterprises, while others are intent-driven.
In any case, you should always evaluate a potential data partner based on multiple factors, including data sources, delivery, freshness, and your use case.
Why is multi-source technographic data important?
On their own, all data sources have blind spots. For instance, specialized portals might not have the latest data, while job postings focus on future priorities without confirming adoption.
Building a comprehensive, accurate view of a company’s technology stack, including hardware, software, and SaaS, requires a multi-source approach that combines web scraping with job postings and company data. This:
- Reduces bias
- Improves accuracy
- Boosts GTM efficiency.
By aggregating data from multiple sources, teams can more easily identify high-intent prospects while gaining deeper insights and backing their decisions with accurate data.
How fresh should technographic data be to stay useful?
Data freshness is one of the most important differentiators when choosing a technographic data provider. Unlike firmographics, which can get away with periodic updates that align with major company events, technographics is far more dependent on fresh data.
Companies regularly adopt new tools and sometimes even migrate entire platforms. So, six-month-old data doesn’t exactly cut it here; it can lead to outreach for problems a company has already solved or even target the wrong prospects entirely.
Periodically updated technographic data will work just fine for market research or historical analysis. But for many other use cases, such as active sales prospecting, intent detection, or account monitoring, the fresher the data, the better.
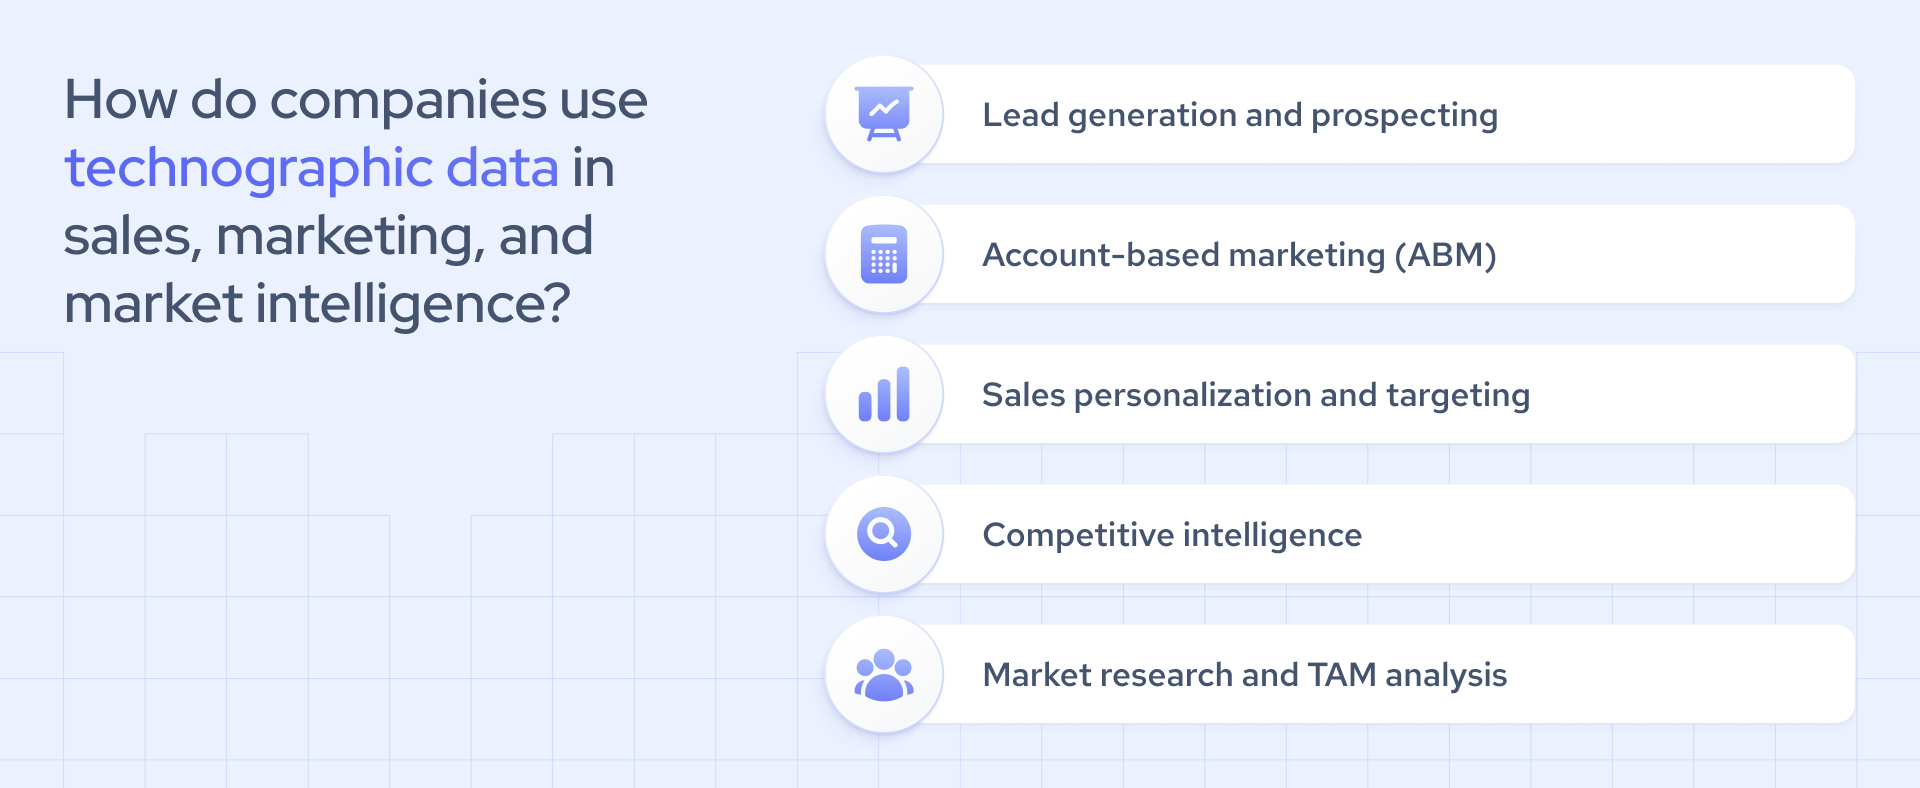
How do companies use technographic data in sales, marketing, and market intelligence?
While it can bring a competitive advantage to all data-driven revenue-focused teams, technographic data is most commonly used for:
- Lead generation and prospecting: Sales teams rely on technographic datasets to find companies with a tech stack gap that their own solutions can fill.
- Account-based marketing (ABM): Segmenting prospects by tech stacks enables ICP refinement and ABM competitor displacement, with marketing budgets being spent only on companies with the right technical environment.
- Sales personalization and targeting: Marketing teams can tailor messages to an organization’s current tech stack and common pain points, thereby boosting campaign efficiency.
- Competitive intelligence: Technographics enables companies to map which tools competitors and their customers are actively adopting, allowing them to track customer attrition from said competitors.
- Market research and TAM analysis: Strategy teams can conduct a total addressable market (TAM) analysis to estimate market size, identify future trends, and assess the feasibility of a new product rollout.
How can I access and use technographic data through an API?
To access technographics through an API, you’ll first need an technographic API authentication key from your technographic data provider. You can then review the documentation to identify the endpoints for the tech stacks and use tools like Python’s Requests library for GET or POST calls.
In most cases, such as with Coresignal’s APIs, you can call the relevant endpoint with filters for company domain, technology name, industry, and location and receive a structured response in JSON or CSV format, with records that perfectly match your ICP.
Many modern sales teams also choose to integrate a technographic data API directly into their CRMs. This allows them to automatically pull responses, map them out to existing fields, and update records with little to no manual effort.
And if you don’t want to mess with an API, bulk datasets are the main alternative. But, while they can work wonders for historical analysis or even AI model training, they lack the flexibility and speed of a technographic data API.
Can technographic data be used to train AI models?
Yes, technographics can be and often is used for AI training. In my experience, companies feed technographic data into an AI model so they can use it to identify patterns, predict software needs, segment companies by current tech stacks, and score leads accordingly.
That said, there are a few challenges here:
- Clean, standardized, and enriched technographics is a must-have if you want to avoid flawed results.
- Historical data is paramount for AI models to learn about tech stack trends and produce accurate outputs.
- Biased data collection, missing fields, and outdated data records can also affect the model’s accuracy.
So if you’re looking for a technographic data provider for AI model training, make sure to team up with one that has AI-ready datasets that address these challenges.
How much does technographic data typically cost?
While the price of technographic data varies from vendor to vendor, whether you go for a monthly subscription, API credits-based access, or a one-time use technographic dataset matters even more. For instance, Coresignal’s technographic data can be accessed with a subscription, starting from $49 per month.
Data volume, geographic coverage, update frequency, and enrichment depth can all affect the final cost, as well. Obviously, the broader the dataset and the more frequently it’s updated, the higher the price.
As teaming up with a technographic data provider can be a pretty big commitment, it’s always best to go for a trial run first. This could involve something like Coresignal’s 7-day free trial for a technographic data or a sample dataset that lets you see if the vendor meets your needs.
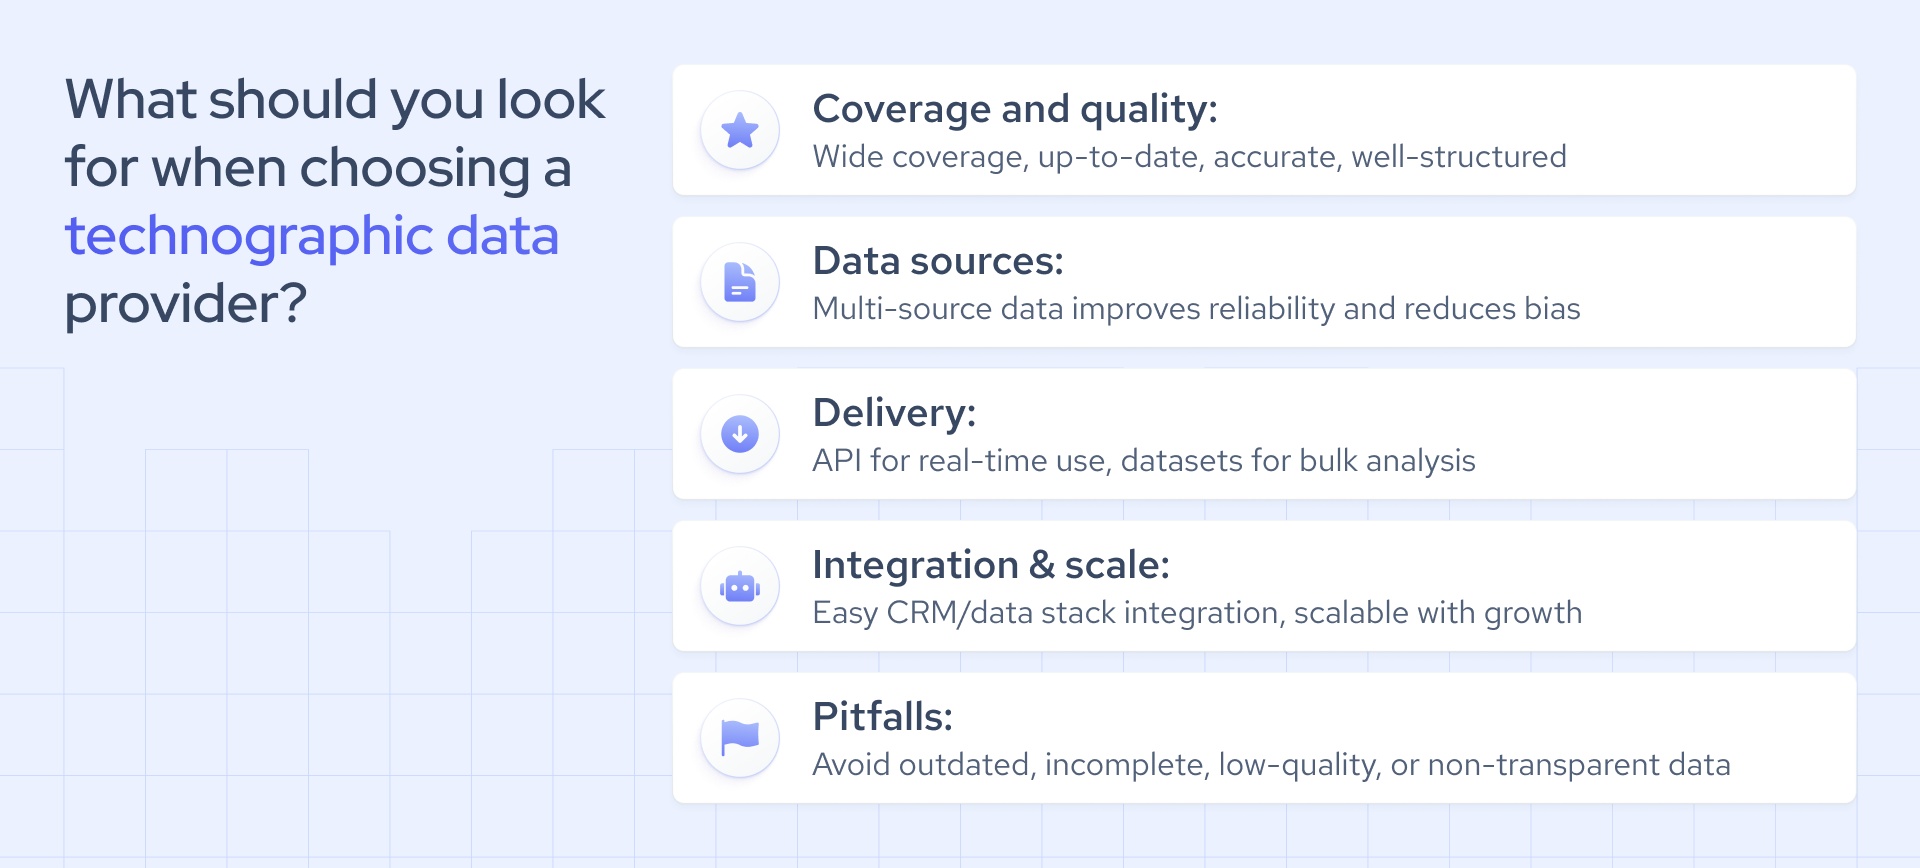
What should you look for when choosing a technographic data provider?
When choosing a technographic data provider, you should evaluate the same aspects that affect pricing, along with a few more. Here’s what to consider:
- Data coverage and quality, structure, and standardization protocols
- Data sources
- Data accuracy and update frequency
- Data delivery options, such as API-based access and datasets
- Integration with your existing CRM or sales engagement tools
The vendor’s sourcing methods also play a big role, with multi-source-capable providers being the obvious choice.
Skip any of these checks, and you can end up with a shiny dashboard with low-quality underlying data that’s either outdated or has woefully incomplete records, or both.
How is the technographic data market evolving in 2026?
The B2B technographic data landscape is undergoing a major transformation. The days of static repositories of software installations and "buy a dataset once a year" approaches are slowly coming to an end, with API-based delivery that enables real-time intelligence taking their place.
2026 is obviously the year of AI and agentic systems, and the demand for already-enriched AI-ready technographic datasets, be it for automation, GTM workflows, or analytics pipelines, proves it. The same goes for multi-source data, with most modern teams now combining company, employee, job, and technographic datasets to generate the ultimate insights.