Many investors and organizations rely on data to enrich their decision-making process. From development to sales, quality data insights can provide professionals with insights into every aspect of their business operations.
While this may seem rather straightforward, there are quite a few processes that must be followed so you can utilize data’s full potential. This is where data interpretation comes in.
What is data interpretation?
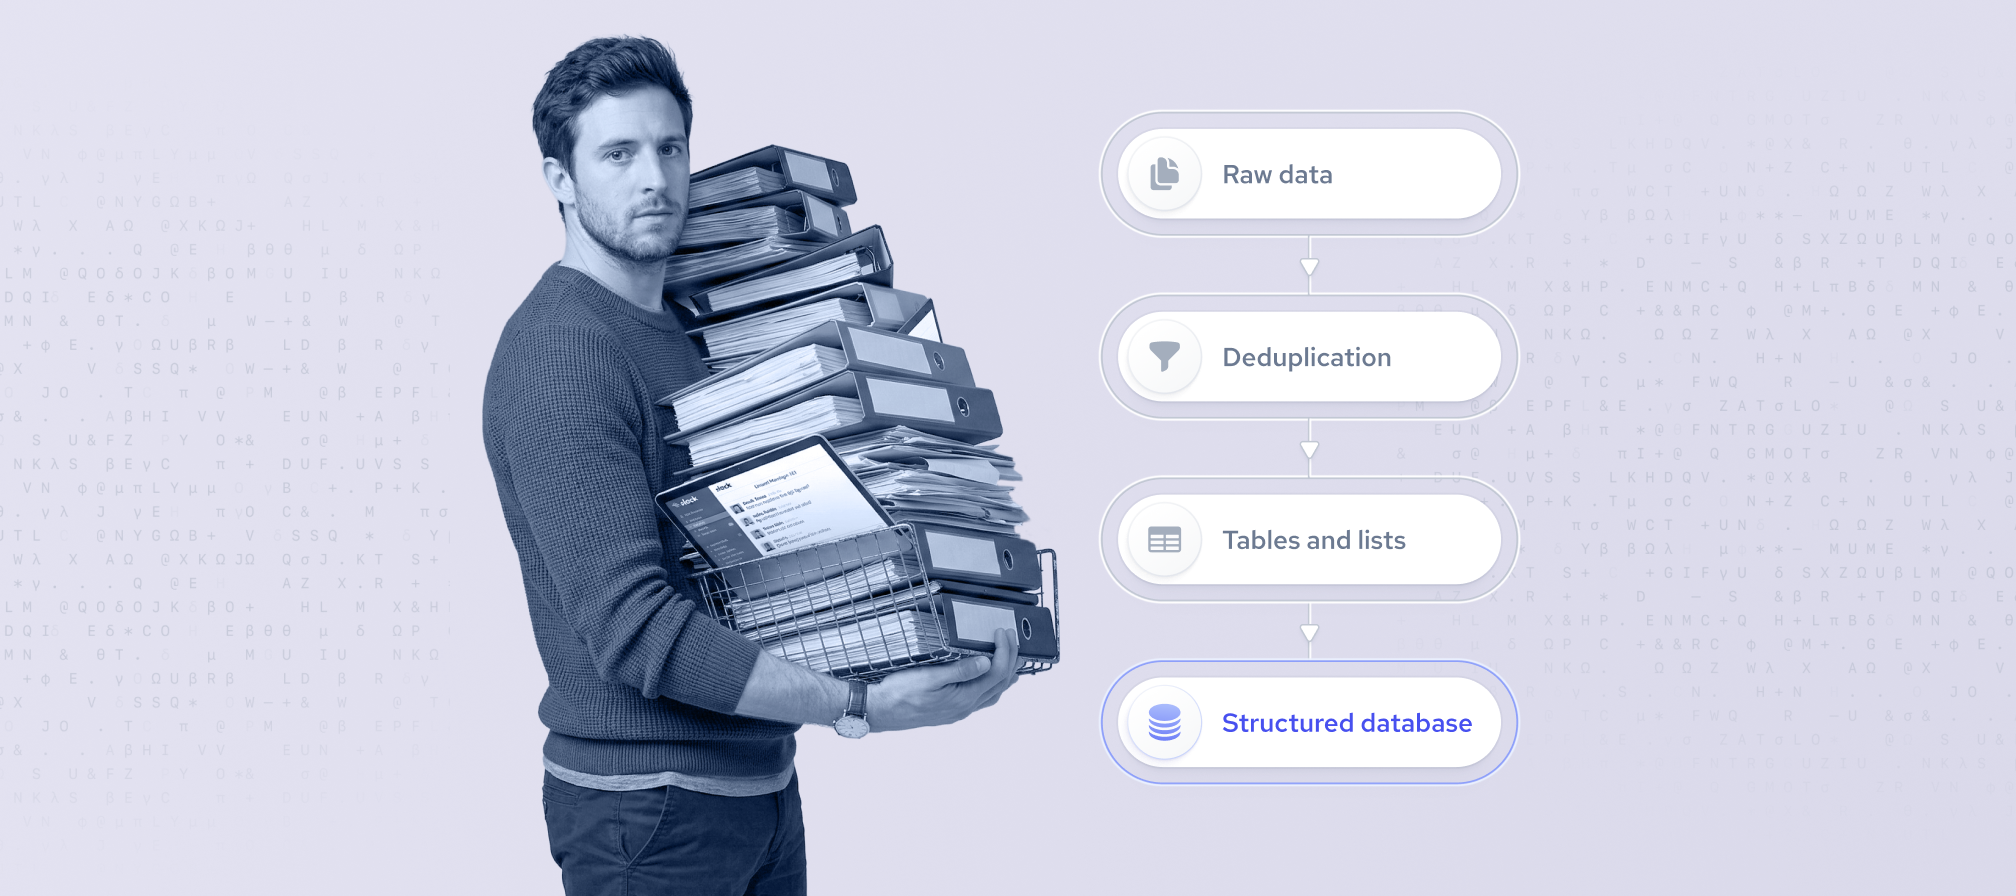
Data interpretation is the process of analyzing, evaluating, and explaining data in order to extract meaningful insights and support decision-making. The goal here is to transform raw data into actionable knowledge through statistical analysis, visualization, and contextual understanding.
There are many steps involved in data interpretation, as well as different types of data and data analysis processes that influence the larger data interpretation process. This article will explain the different data interpretation methods, the data interpretation process, and its benefits.
Data interpretation is the process of analyzing, evaluating, and explaining data in order to extract meaningful insights and support decision-making.
Data interpretation vs data analysis
Data analysis and data interpretation are closely related, but they are not the same.
Data analysis is the technical process of organizing, cleaning, transforming, and examining data in order to identify patterns, trends, relationships, or anomalies. It focuses on what the data shows through methods such as statistical testing, comparison, categorization, or visualization.
In other words, analysis turns raw data into structured findings. Data interpretation comes after analysis. It is the process of explaining what those findings mean in relation to the research question, business goal, or practical problem. Interpretation moves from results to meaning. For example, analysis may show that customer satisfaction scores dropped by 12% over six months, while interpretation of data considers why that decline matters, what factors may have caused it, and what implications it has.
The key difference lies in purpose. Analysis is concerned with discovering and describing evidence within the data, while interpretation is concerned with drawing conclusions from that evidence. Analysis answers questions such as “What changed?”, “How much?”, or “Is there a relationship?” Interpretation answers questions such as “Why is this important?” and “What should be understood or done as a result?”
Although distinct, the two processes depend on each other. Accurate interpretation requires sound analysis, and analysis becomes useful only when its results are interpreted in context. Together, they help transform data into knowledge that can support understanding, explanation, and action.
Why is data interpretation important?
The importance of data interpretation is not far from the importance of other data processes. Much like implementing data normalization and understanding data quality, proper interpretation of data offers real-time solutions and provides more in-depth insights than without it.
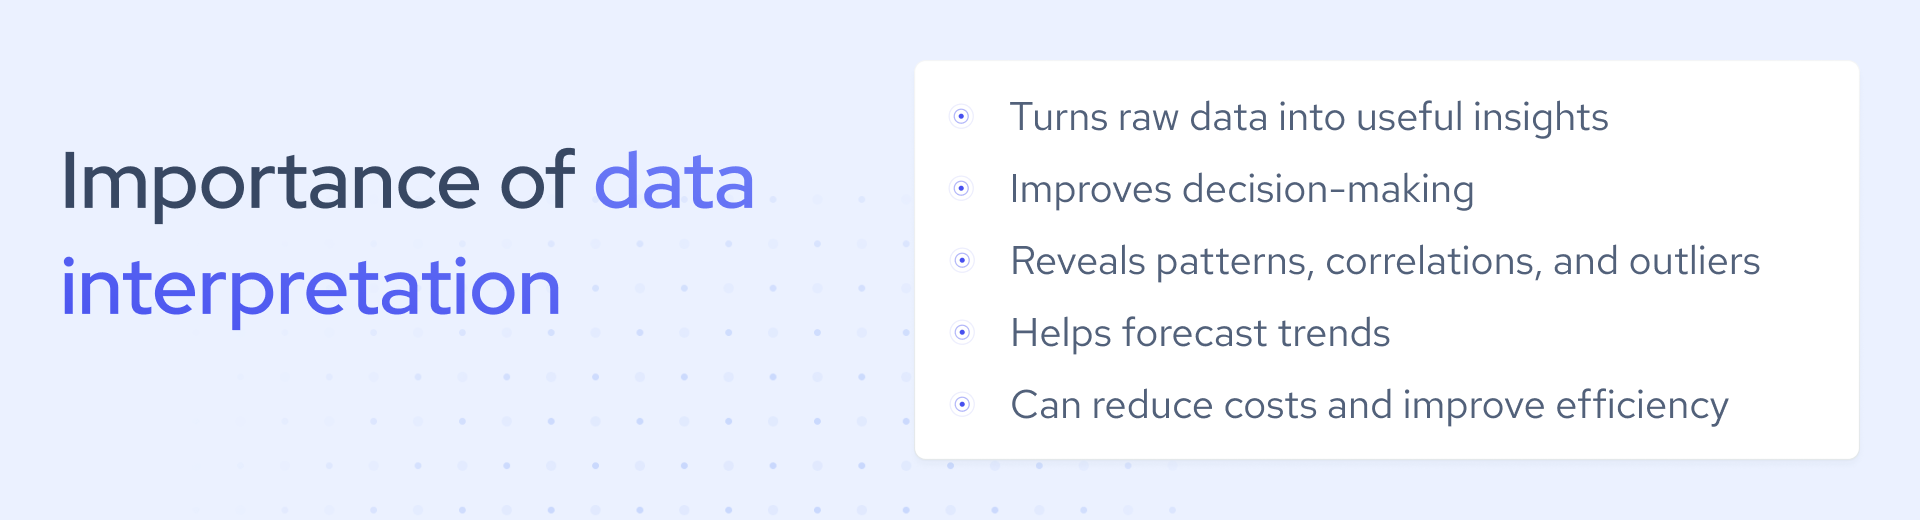
Particularly, data interpretation can improve data identification, discover hidden correlations between datasets, find data outliers, and even help forecast trends:
- Better decision-making. It helps businesses make informed choices based on evidence rather than guesswork.
- Identifying trends. It reveals patterns in performance, customer behavior, and market changes.
- Detecting anomalies. It helps spot outliers and unusual shifts that may signal problems or opportunities.
- Improving AI predictions. Better interpretation leads to better inputs, which can improve forecasting and AI outputs.
- Finding hidden relationships. It can uncover connections between data points that support deeper insights.
- Increasing efficiency. Clear insights help businesses reduce waste and focus on what works.
Additionally, proper implementation of data interpretation offers immense benefits such as cost efficiency, enhanced decision making, and improved AI predictions. In a Business Intelligence survey reported that companies that implemented data analysis and interpretation from big data dataset saw a ten percent reduction in costs.
While the importance of data interpretation is undeniable, it is significant to note that this process is no easy feat. To unlock the full potential of your data, you must integrate your data interpretation process into your workflow in its entirety.
Types of data interpretation
Without data analysis, there can be no data interpretation. In addition to its importance, the analysis portion of data interpretation, which will be touched on later on includes two different approaches: qualitative analysis and quantitative analysis.
Qualitative data interpretation
Qualitative data interpretation is the process of examining non-numerical information (customer feedback, interview responses, open-ended surveys, support transcripts) to identify patterns and extract meaning that drives business decisions.
It's easy to confuse this with qualitative data analysis, and the two do overlap. Analysis is the systematic work of sorting and categorizing raw data into patterns. Interpretation is what happens next: asking what those patterns actually mean and what they imply for your strategy. Researcher Harry F. Wolcott framed it clearly: analysis identifies structure and interpretation answers "so what?" That final step is where data stops being academic and starts being useful.
The stakes are real. According to a McKinsey survey of over 1,200 executives, business leaders spend roughly 40% of their time making decisions, and 61% say at least half of that time is ineffective. Much of that inefficiency traces back to the same problem: organizations collect qualitative signals but stop short of interpreting them rigorously. Each customer complaint, interview transcript, a recurring theme in sales calls is a pattern waiting to be understood. Without interpretation of data, it stays that way.
Due to the personable nature of qualitative analysis, there are a variety of techniques involved in collecting this data including interviews, questionnaires, and information exchanges. Not unlike many lead generation techniques, companies often offer free resources in exchange for information in the form of qualitative data, such as e-books in exchange for completing product or demographic surveys.
Quantitative data interpretation
Quantitative data interpretation refers to the process of analyzing numerical data to extract meaning, identify trends, and support evidence-based decisions.
Like its qualitative counterpart, quantitative data interpretation is closely tied to analysis, but the two are distinct. Analysis is the mechanical work: collecting numerical data, running calculations, and producing outputs like means, medians, standard deviations, and ratios. Interpretation is what follows, including contextualizing those outputs, asking what they reveal about real-world behavior, and translating statistical results into decisions a business can act on.
The data feeding this process comes from a wide range of sources. Web scraping, for instance, is a common extraction method used to collect large volumes of public numerical data, such as financial figures, pricing trends, headcount changes, or hiring volumes across companies.
Once extracted and structured, that data becomes the foundation for statistical modeling, forecasting, and benchmarking. The volume involved is significant: quantitative datasets routinely span millions of records, which is precisely why interpretation requires more than just math. Without a clear framework for what the numbers mean in context, even the most rigorous analysis produces conclusions that are technically accurate but strategically inert.
Similar to the qualitative process, the collection of this quantitative data can involve a variety of different processes. For example, web scraping is a common extraction technique used to collect public online quantitative and qualitative data. In the same way web scraping can be used to extract quantitative data, such as social sentiment, it can also be used to extract numerical data, such as financial data.
If you're looking for data to identify business opportunities, you can perform both types of analysis with Coresignal's raw data.
How to interpret data
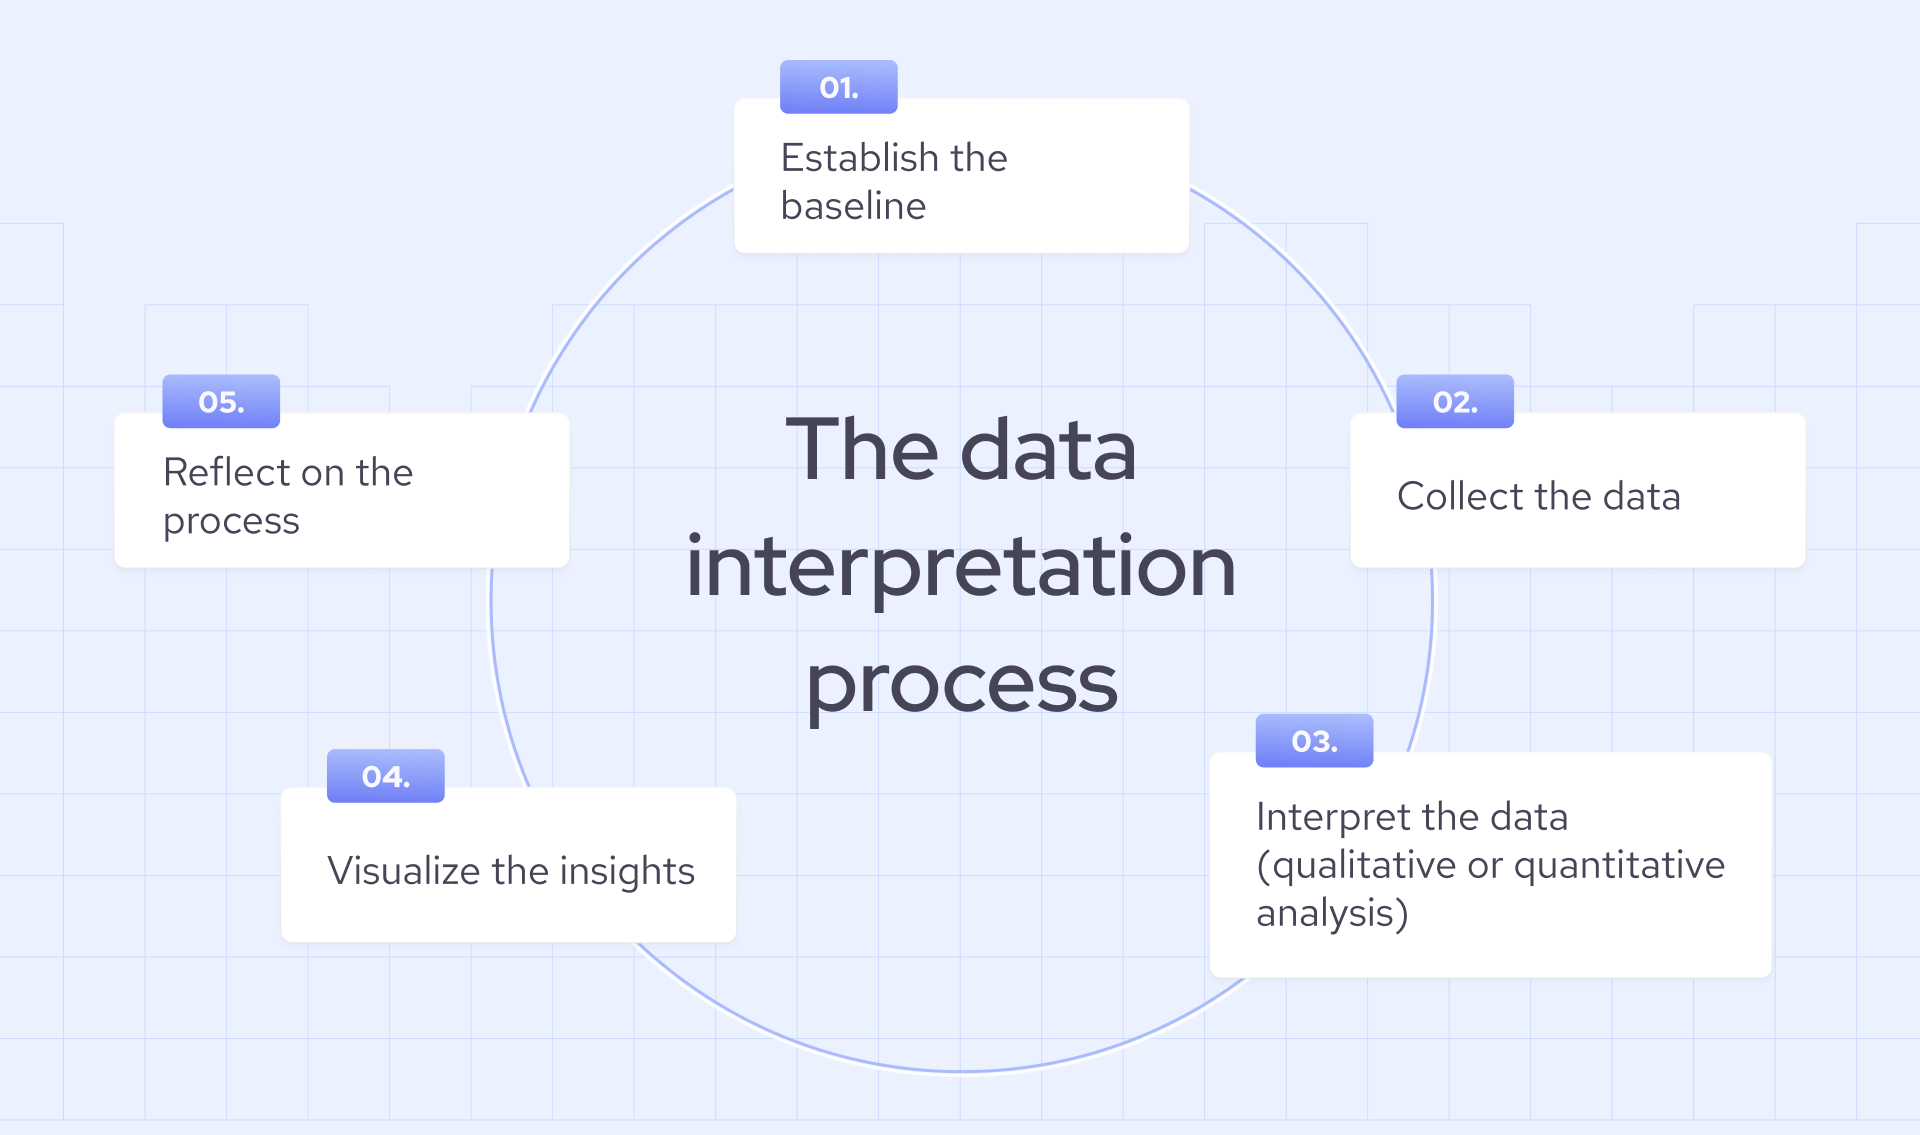
Now that we’ve examined the two types of analysis used in the data interpretation process, we can take a closer look at the interpretation process from beginning to end. The five key steps involved in the larger data interpretation process include baseline establishment, data collection, interpretation (qualitative or quantitative analysis), visualization, and reflection. Let’s take a look at each of these steps.
1. Baseline establishment
Similar to the first step when conducting a competitive analysis, it is important to establish your baseline when conducting data interpretation. This can include setting objectives and outlining long-term and short-term goals that will be directly affected by any actions that result from your data interpretation. For example, investors utilizing data interpretation may want to set goals regarding the ROI of companies they are evaluating. It is important to note that this step also includes the determination of which data type you wish to analyze and interpret.
2. Data collection
Now that a baseline is established and the goals of your data interpretation process are known, you can start collecting data. As previously mentioned, the data collection process includes two major collecting types: web scraping and information exchange. Both of these methods are successful at collecting both qualitative and quantitative data. However, depending on the scope of your data interpretation process, you most likely will only require one method.
For example, if you are looking for specific information within a very particular demographic, you will want to target particular attributes within the larger demographic you are interested in. Particularly, let’s say you want to collect sentiment surrounding an application used by a particular job type; you will want to target individuals with a specific job type attribute and utilize information exchange.
Both of these collection methods can be quite extensive, and for that reason, you may want to enrich your data collection or even fully utilize high-quality data from a public web data data provider.
If your use case requires current market signals, such as live hiring trends, recent funding rounds, or up-to-date firmographic changes, a real-time data provider like Coresignal ensures the data entering your interpretation pipeline reflects what's happening now. With an average API response time of 176ms and webhooks that trigger updates the moment a tracked field changes, Coresignal removes the lag between market reality and your analysis.
Notably, once your data is collected, you must clean and organize your data before you can proceed to analysis. This can be achieved through data cleansing and data normalization processes.
3. Interpretation (qualitative or quantitative)
This step is arguably the most crucial one in the data interpretation process, and it involves the analysis of the data you’ve collected. This is where your decision to conduct a qualitative or quantitative analysis comes into play.
Qualitative interpretation will require you to use a more subjective lens. Once you have the data analysis done, you will have to look into the possible causes behind them.
On the other hand, qualitative analysis requires that the data be analyzed through a numerical and mathematical approach. As previously mentioned, raw numerical data will be analyzed, resulting in mean, standard deviation, and ratios, which can then be interpreted further via statistical modeling to better understand and predict behaviors.
4. Visualization
When your analysis and interpretation is complete, you can now start to visualize your data and draw insights from various perspectives. Today, many companies have implemented dashboards as a part of the visualization stage. Dashboards essentially provide you with quick insights via programmable algorithms.
Even without dashboards formatting your data for visualization is relatively straightforward. To do this, you must input and format your data into a format that supports visualization. Some of the more common visualization formats include:
- Barcharts
- Tables
- Scatter plots
- Line graphs
- Pie charts
- Histograms
5. Reflection
Lastly, once you have created adequate visualization types that meet your previously decided objectives, you can reflect on the insights. While a rather simple process, relative to the earlier steps, the reflection process can make or break your data interpretation process.
During this step, you should reflect on the data analysis process as a whole, look for hidden correlations, and identify outliers or errors that may have affected your visualization charts (but could have been missed during the data cleansing stage). It is crucial that during this step you differentiate between correlation and causation, identify bias, and take note of any missed insights.
One often overlooked factor at this stage is data freshness. If the underlying data were stale at the point of collection, even a well-executed interpretation process would produce misleading insights. Real-time data providers like Coresignal help mitigate this risk by ensuring the inputs to your interpretation process are up to date from the start.
Data interpretation techniques
Several data interpretation techniques help turn raw numerical data into actionable conclusions. Each builds on the last, moving from description to prediction:
- Descriptive analysis is the starting point. It summarizes historical data to establish what has already happened, such as revenue by quarter, headcount by region, hiring volume by month.
- Comparative analysis sets that picture in context, measuring performance against a benchmark, a competitor, or a prior period to surface gaps and opportunities.
- Correlation analysis identifies whether a relationship exists between two variables and how strong it is, which is useful, for instance, in determining whether headcount growth at a target account actually precedes a buying decision.
- Trend analysis extends this over time, surfacing recurring patterns like seasonal hiring surges or sustained workforce decline within a specific sector.
- Statistical modeling takes historical patterns further, using algorithms to forecast future outcomes, including predicting market shifts, churn risk, or talent supply before they materialize.
Together, these techniques form a clear progression: from describing the past to understanding it, and from understanding it to anticipating what comes next.
Data interpretation AI
AI has meaningfully accelerated data interpretation, including automating pattern recognition, flagging anomalies, and processing volumes of data no human team could handle manually. But automation and data interpretation AI are not the same thing. Most businesses would benefit from implementing human oversight specifically to catch AI errors before they reach product, and for good reason.
Two risks stand out:
- Automation bias. The tendency of humans to default to AI-generated decisions, even when those decisions conflict with other data or expert judgment. This is known as automation bias. When analysts stop questioning AI outputs, their interpretations can be wrong.
- Bias in training data. AI models interpret new data through the lens of what they were trained on. A 2024 UNESCO study found that major large language models associate women with "home" and "family" four times more often than men – a direct result of historical bias embedded in training datasets. Allowing AI to interpret the results without considering AI bias can lead to inaccurate outputs.
The practical implication for executives is straightforward: AI can surface what the data shows, but determining what it means, and whether to act on it, still requires human judgment. As AI becomes further embedded in business workflows, that distinction will only grow more consequential.
Examples of data interpretation
The same raw numbers can tell very different stories depending on how they're interpreted. Here are three scenarios that illustrate the difference between seeing data and understanding it:
- From a marketing campaign to a traffic source. Imagine a scenario where a marketing campaign drives a 32% increase in organic traffic. Analysis confirms the spike. During the interpretation process, you ask why this happened. You can trace the change back to a single blog post that ranked for a high-intent keyword. The decision that follows isn't to run more campaigns but to produce more content targeting this keyword cluster. Data-driven content strategies of this kind are associated with meaningful organic traffic gains and faster revenue growth for marketing teams.
- From hiring trends to an industry signal. A surge in AI engineering job postings at competitor companies isn't just an HR observation but a leading indicator of product investment. When interpreted correctly, this signal indicates where the budget and strategic focus are moving.
- From customer churn to a product gap. Interpreting a rising churn rate solely as a retention problem misses the underlying signal. When mapped against product usage data, it often reveals a specific feature gap or onboarding friction point, which turns a sales metric into a product roadmap input.
Wrapping up
Data interpretation is a critical part of real-world, data-driven decision-making. When done regularly as part of an ongoing, iterative process, it helps organizations uncover patterns, identify opportunities, and make smarter strategic choices.
Its importance can already be seen across fields such as investing, product development, sales, and customer acquisition, where hidden insights often create a competitive advantage. Looking ahead, its value will only grow as businesses rely more heavily on real-time data and continuous analysis.
Ultimately, data alone does not create success. It is the ability to interpret insights and act on them effectively that drives long-term results.